Analyze Plugins (Deprecated)
The Explore and Dashboard navigation tabs in the Meltano UI are no longer enabled by default due to Meltano's new direction towards supporting analysis plugins (i.e. Lightdash, Superset, etc.). These features will be removed in Meltano v2.0.
For current users of these tabs, they can be re-enabled by running `meltano config set meltano ui analysis true`.
If you haven’t already, install Meltano and create your first project by following the Getting Started guide. You can come back here before adding an extractor and loader using the CLI, and use the UI instead.
Start Meltano UI #
Start the Meltano UI web server using meltano ui:
meltano ui
By default, the UI will be available at http://localhost:5000.
Connect Data Sources #
Once you’re inside the Meltano UI, you’ll begin on the Connections page to connect your data sources.
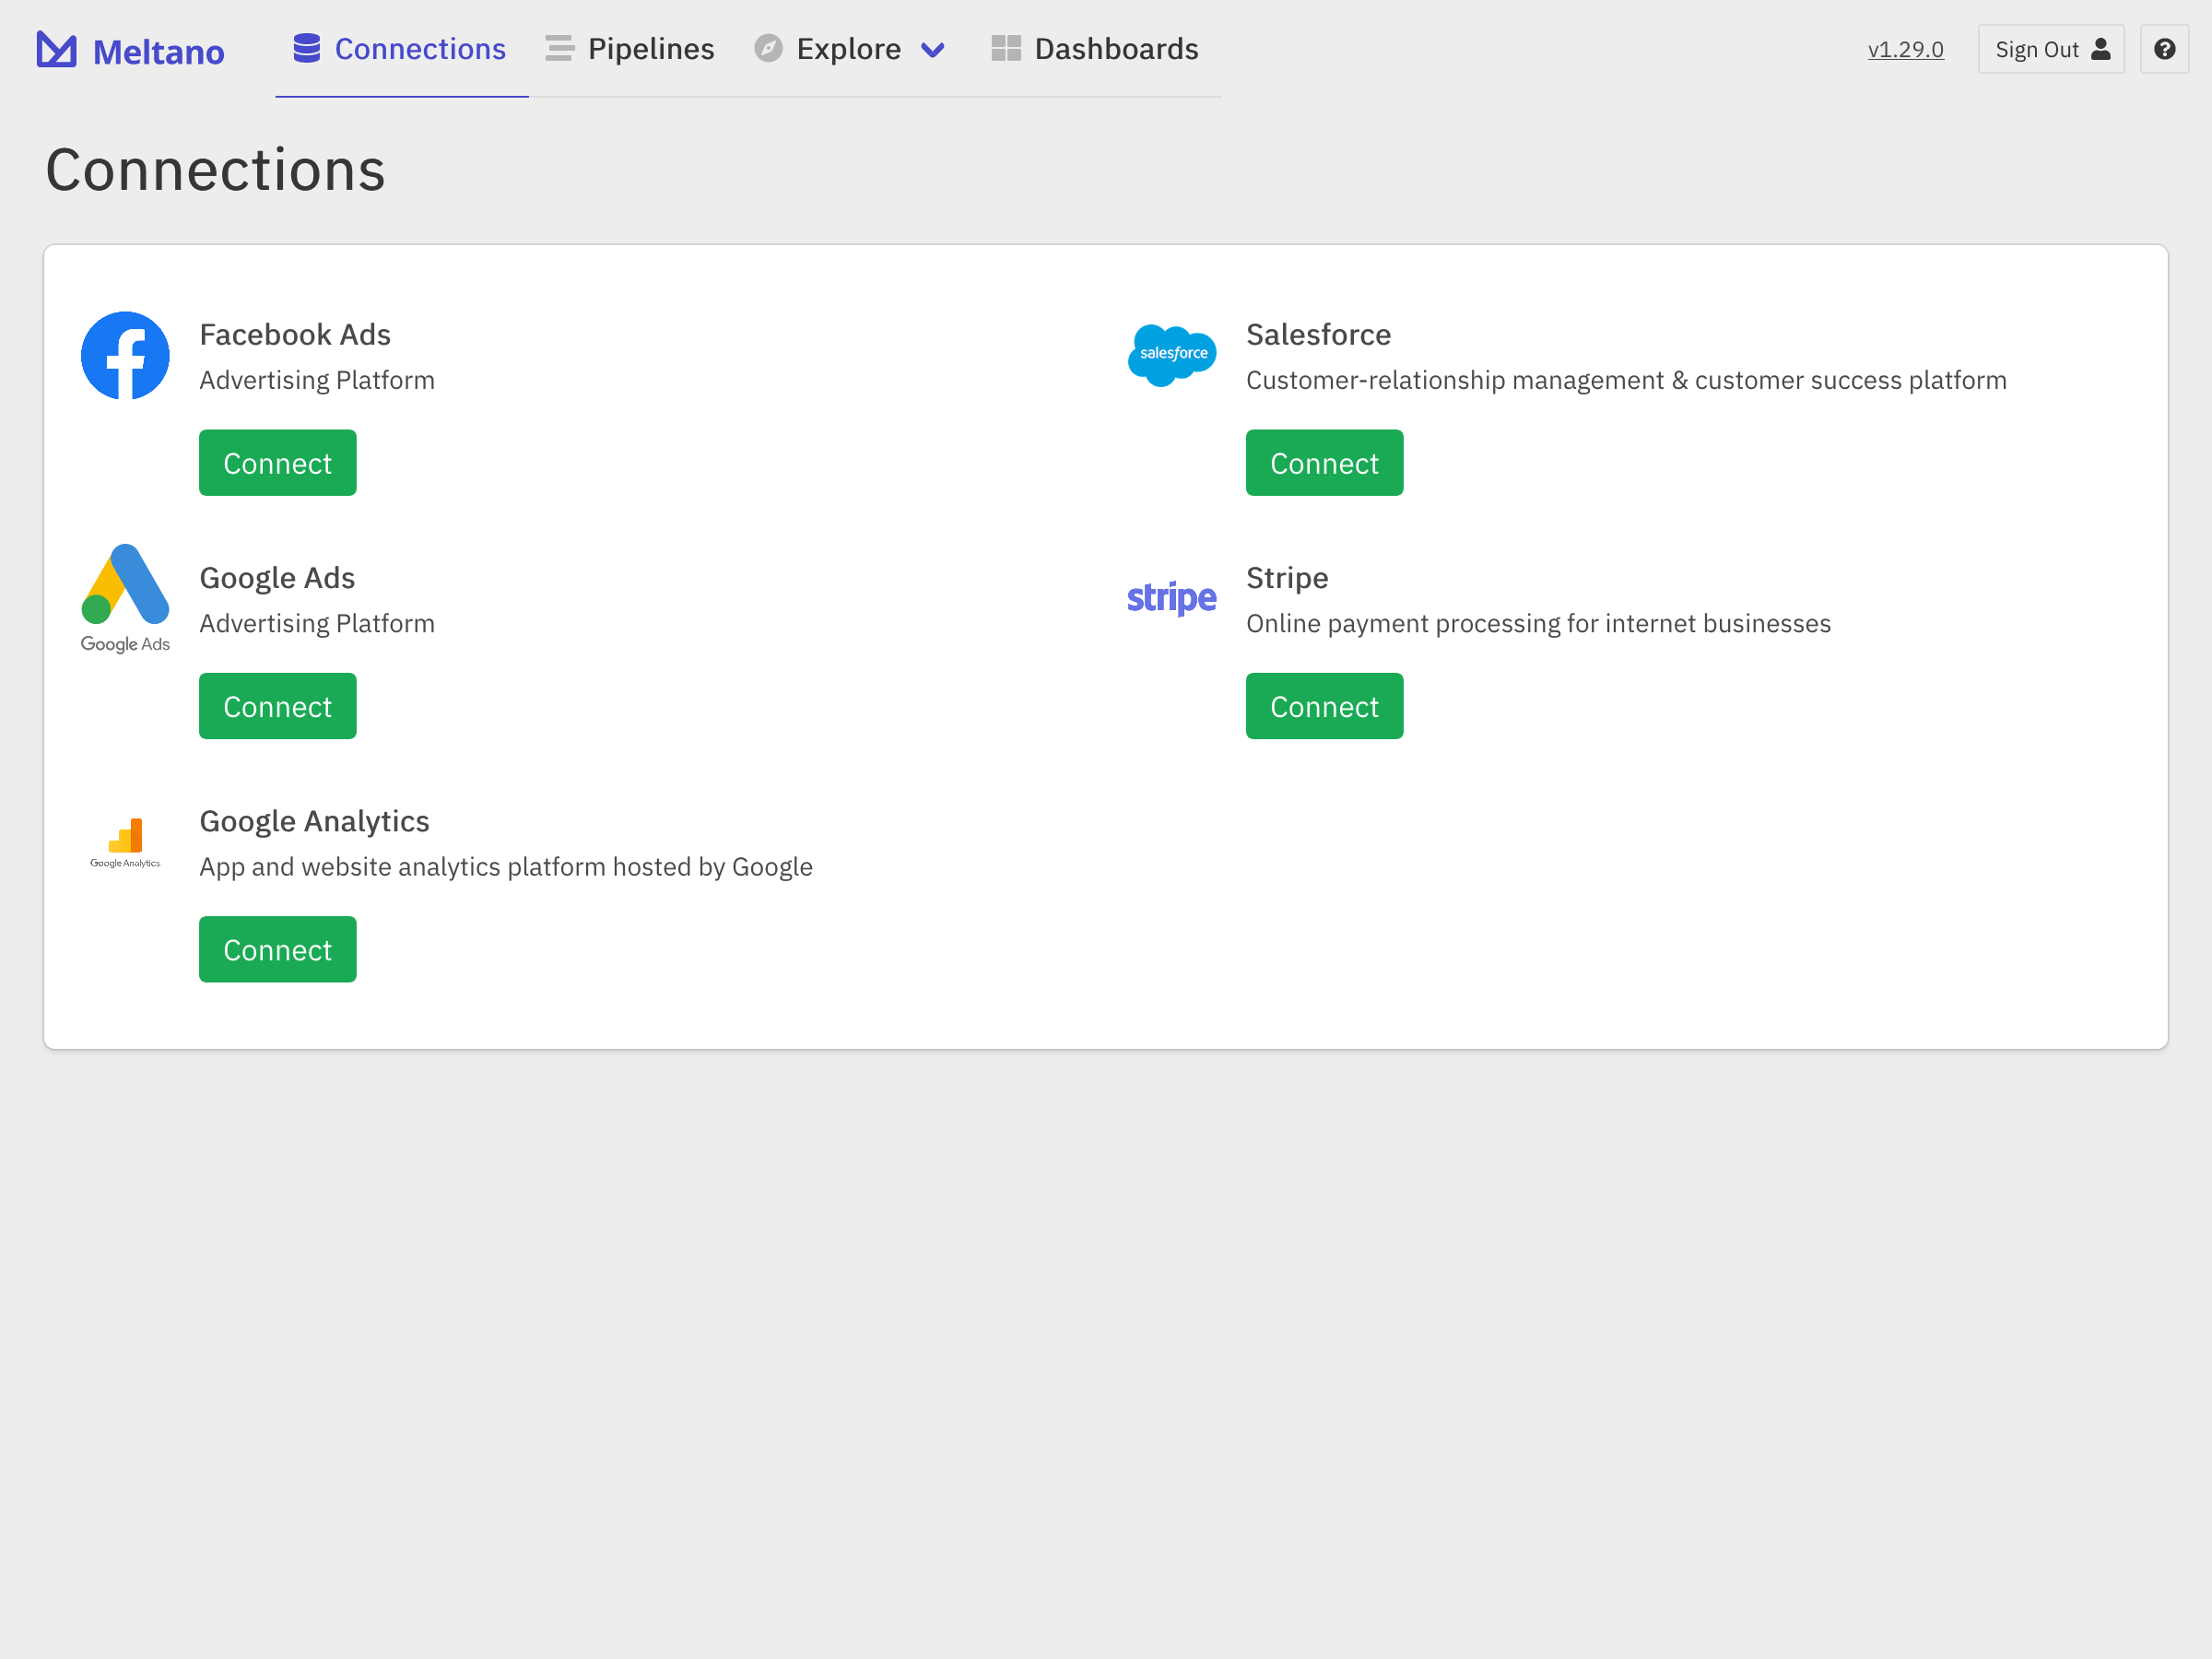
Supported data sources #
The following data sources are fully supported by Meltano UI, from setting up your connection to creating reports and sharing dashboards:
Note that only the PostgreSQL database is currently supported as a data destination.
Don't see your data source listed here?
Additional data sources (including arbitrary Singer taps) are available when using the command line interface.
Connecting a data source #
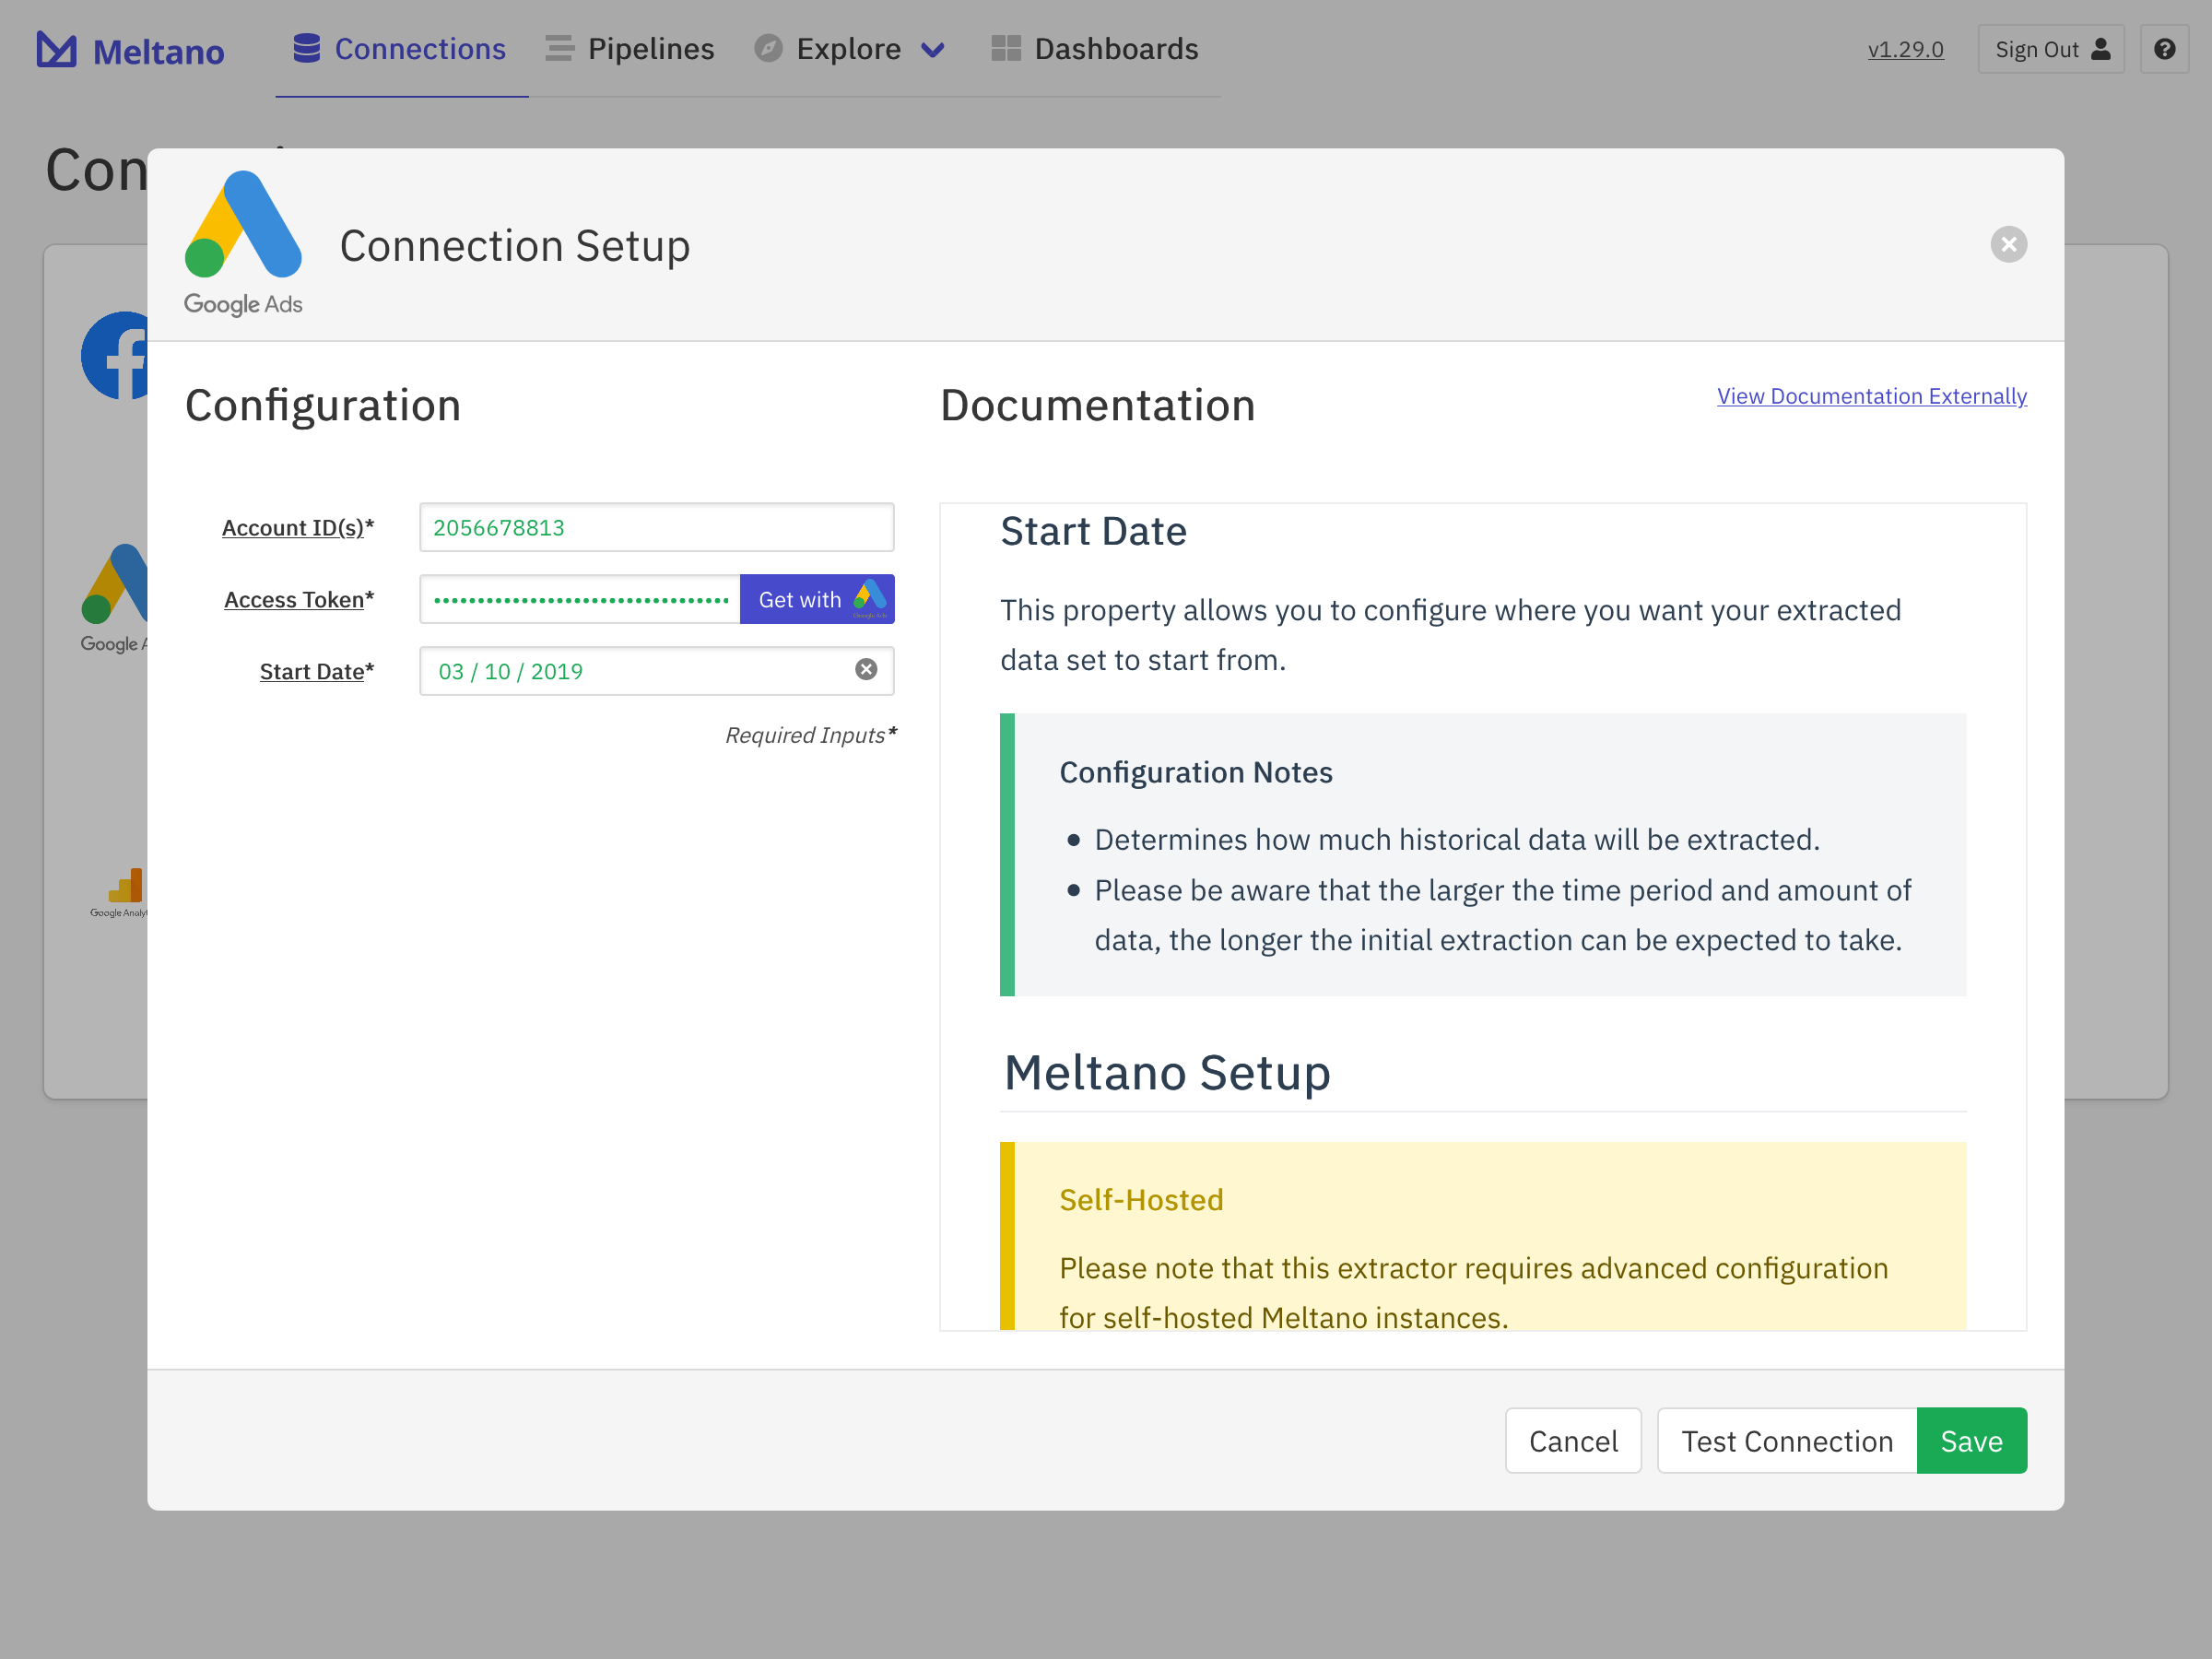
Choose a data source to connect (we’ll use Google Ads in this example), fill in the form with your authentication details, Test Connection to ensure everything is on order, and then hit Save.
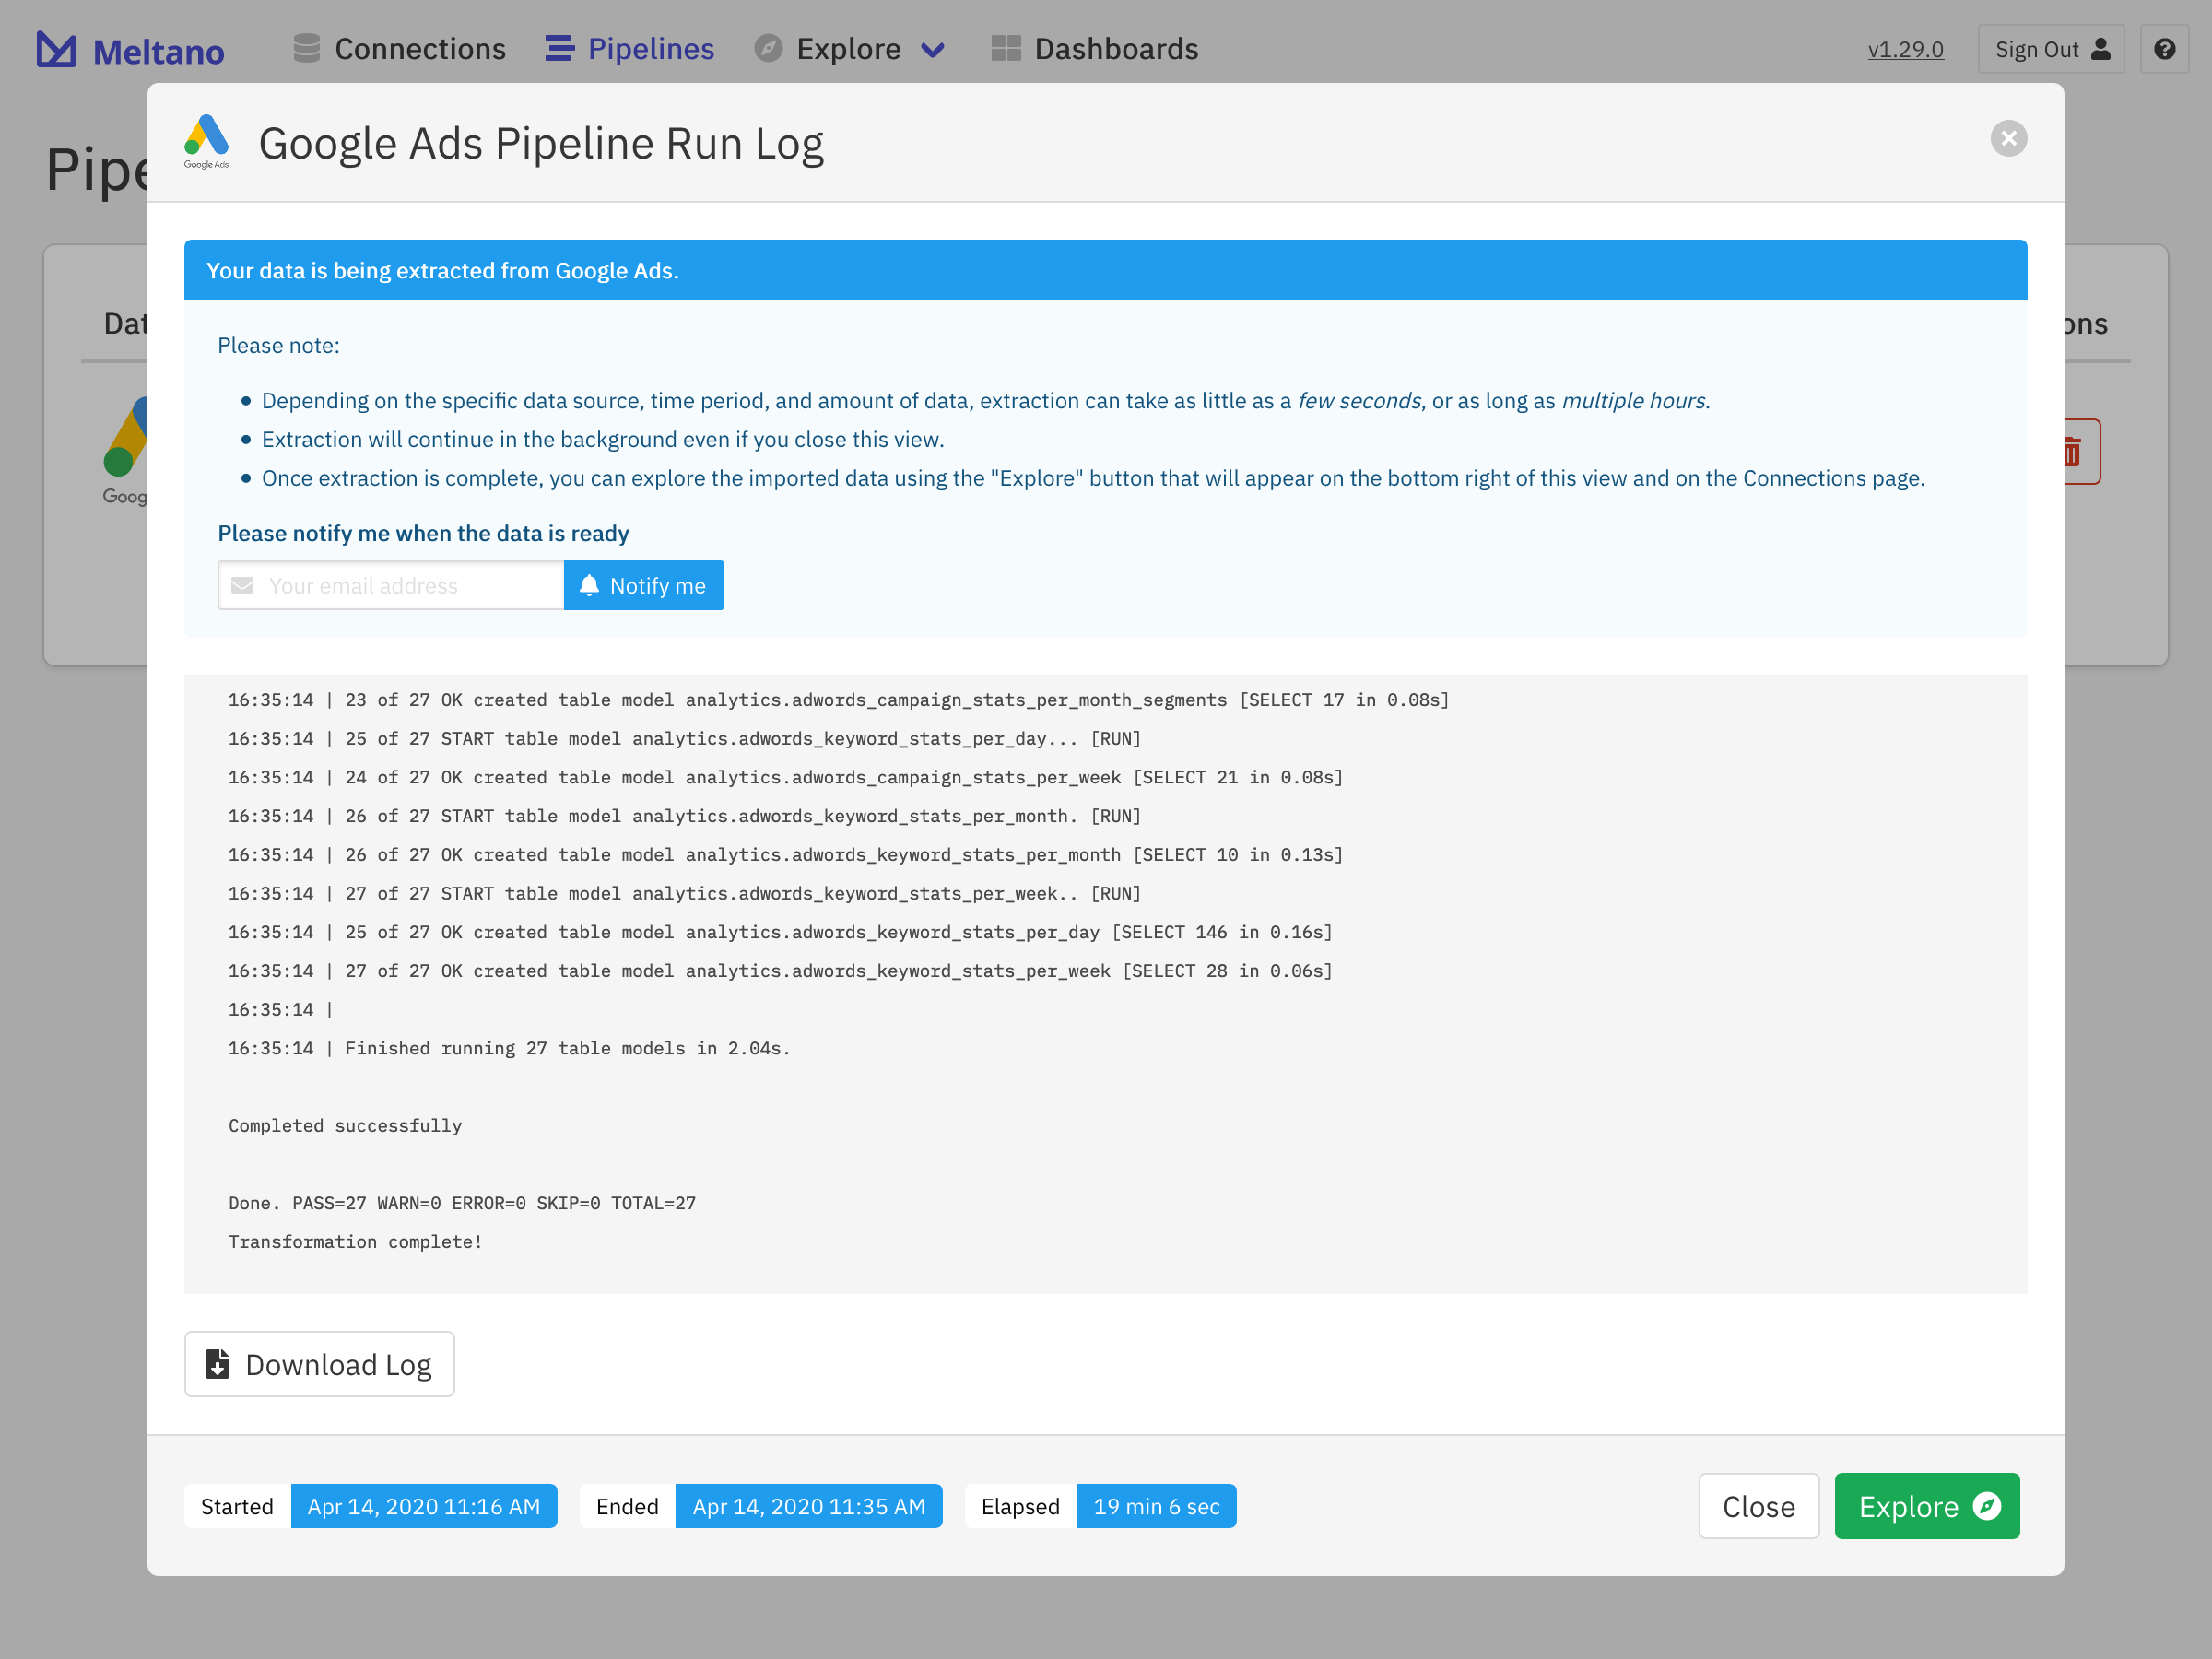
Once saved, we automatically start data extraction for you. The extraction time varies based on the data source and Start Date setting that you previously selected. You can follow along with the progress through the Run Log modal that will appear, but extraction will continue in the background even if you close this view. Once complete you can click the Explore button to start exploring the imported data.
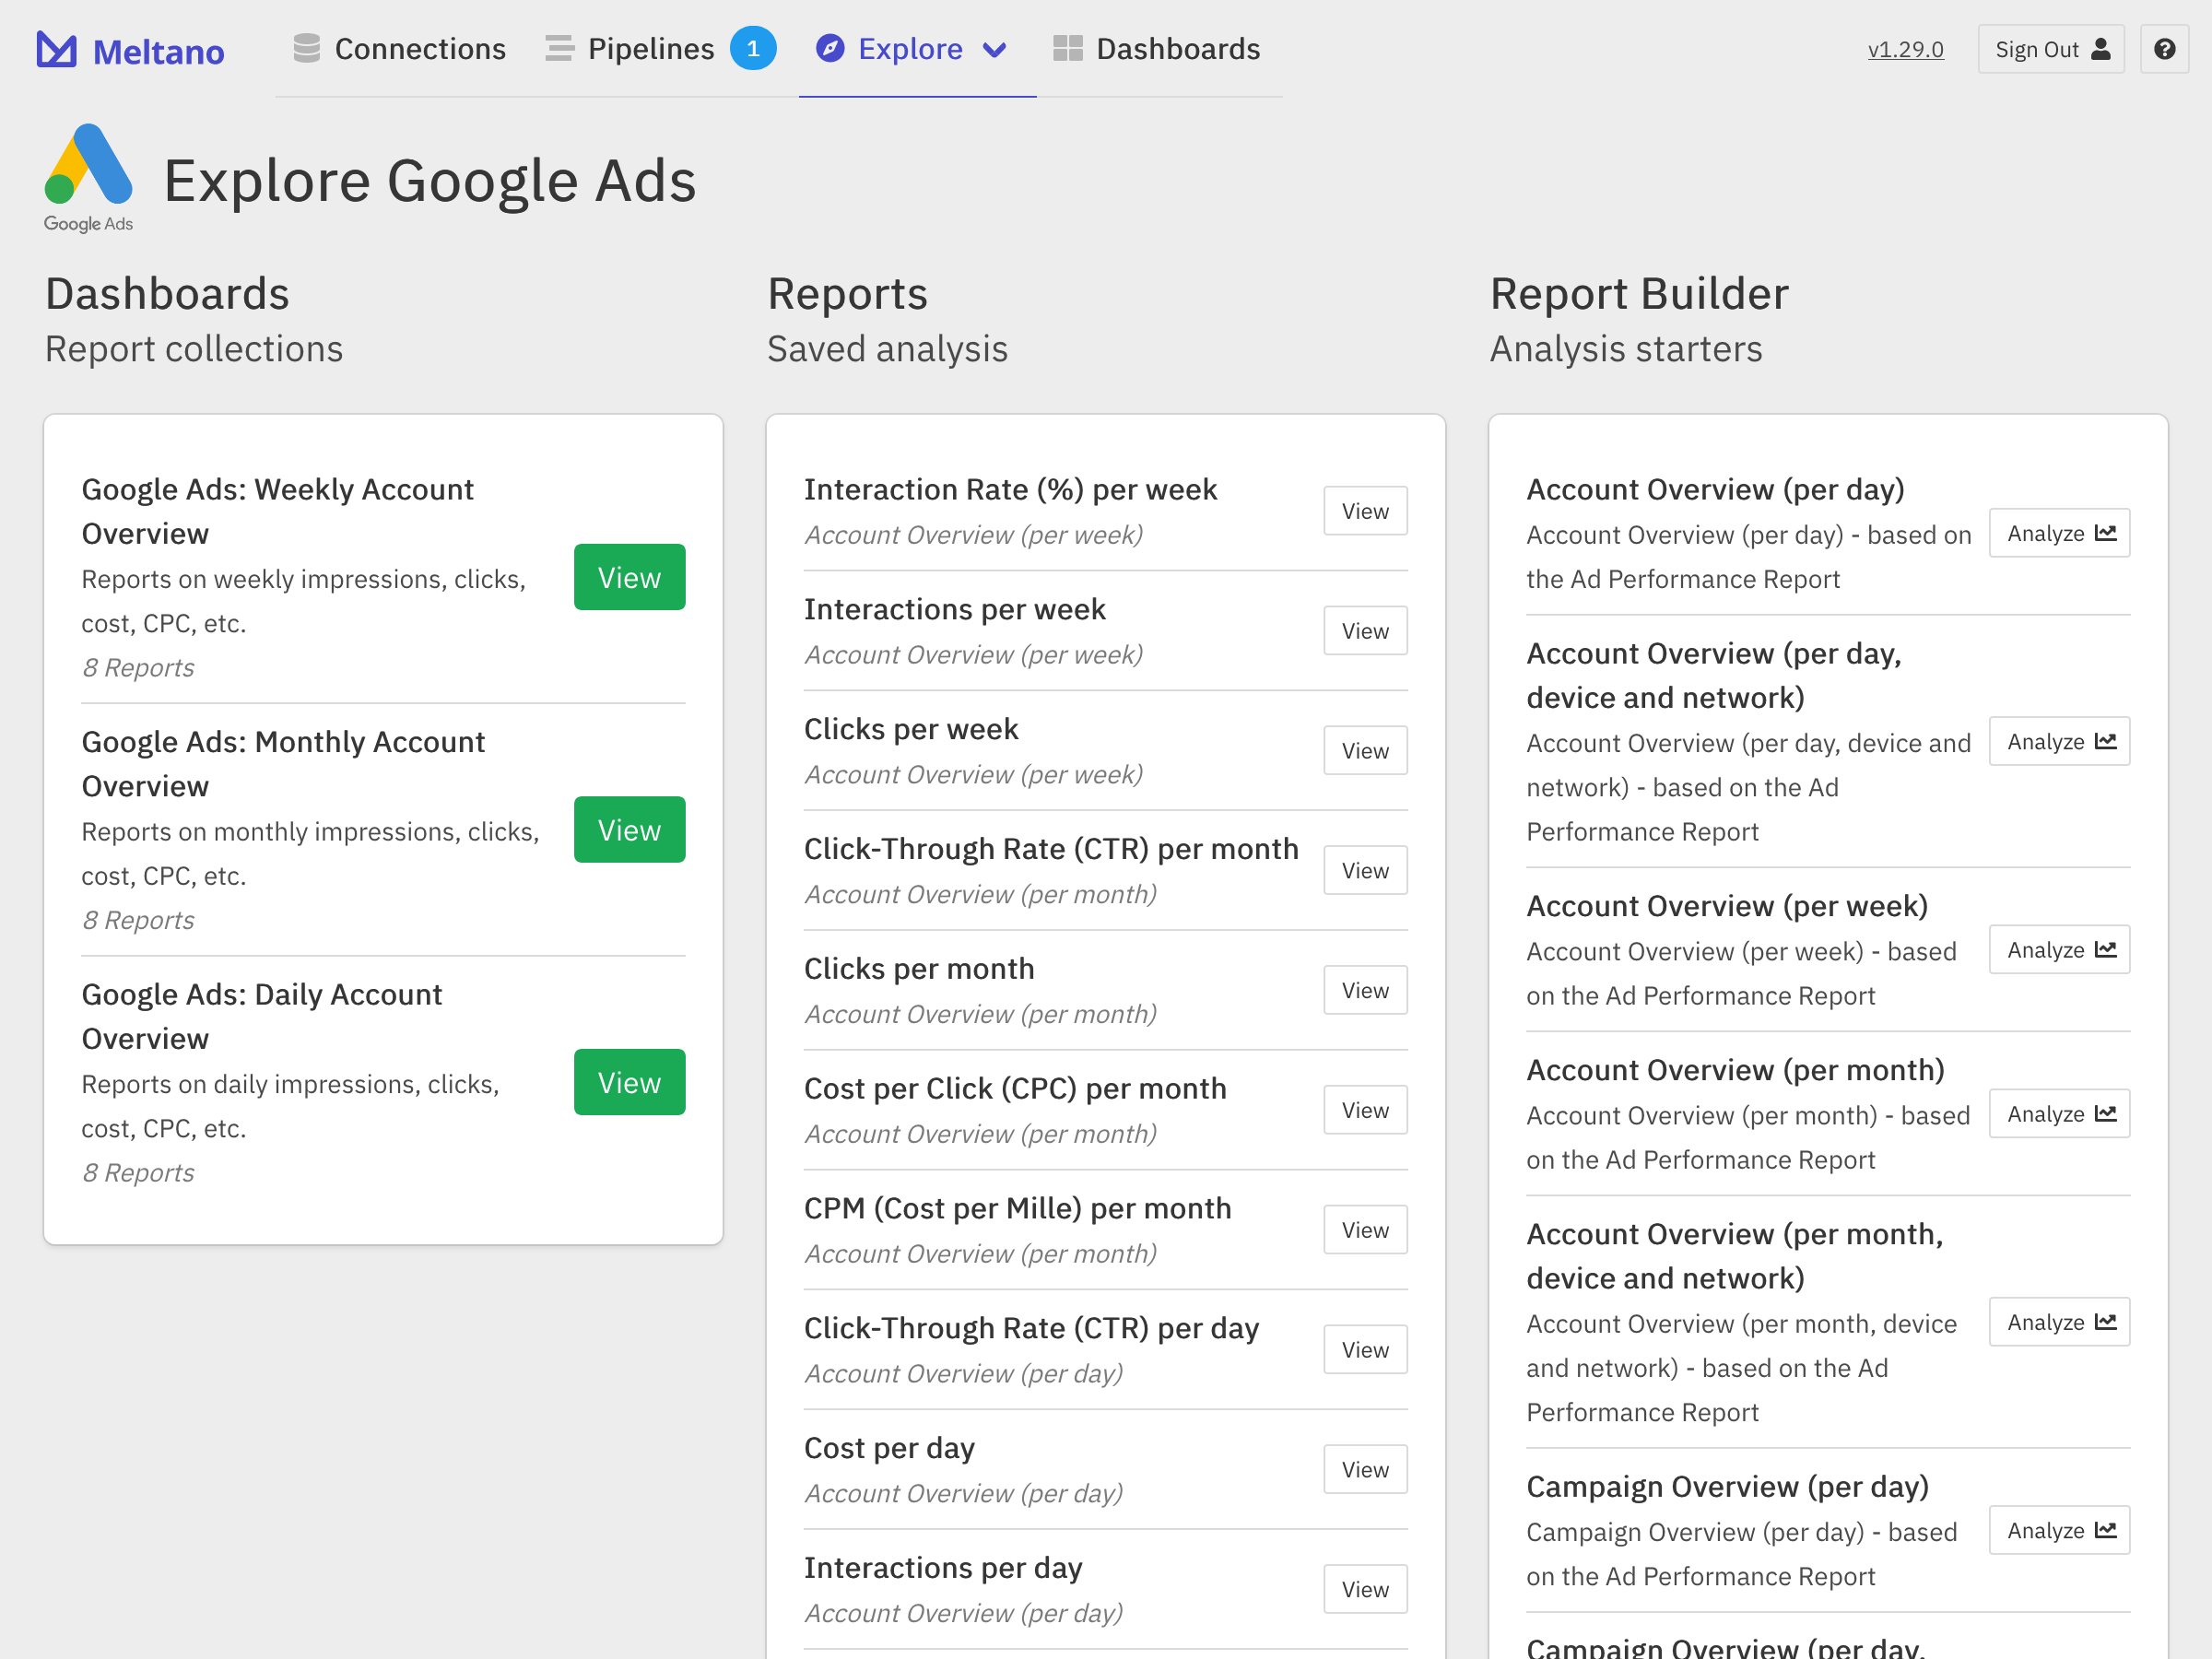
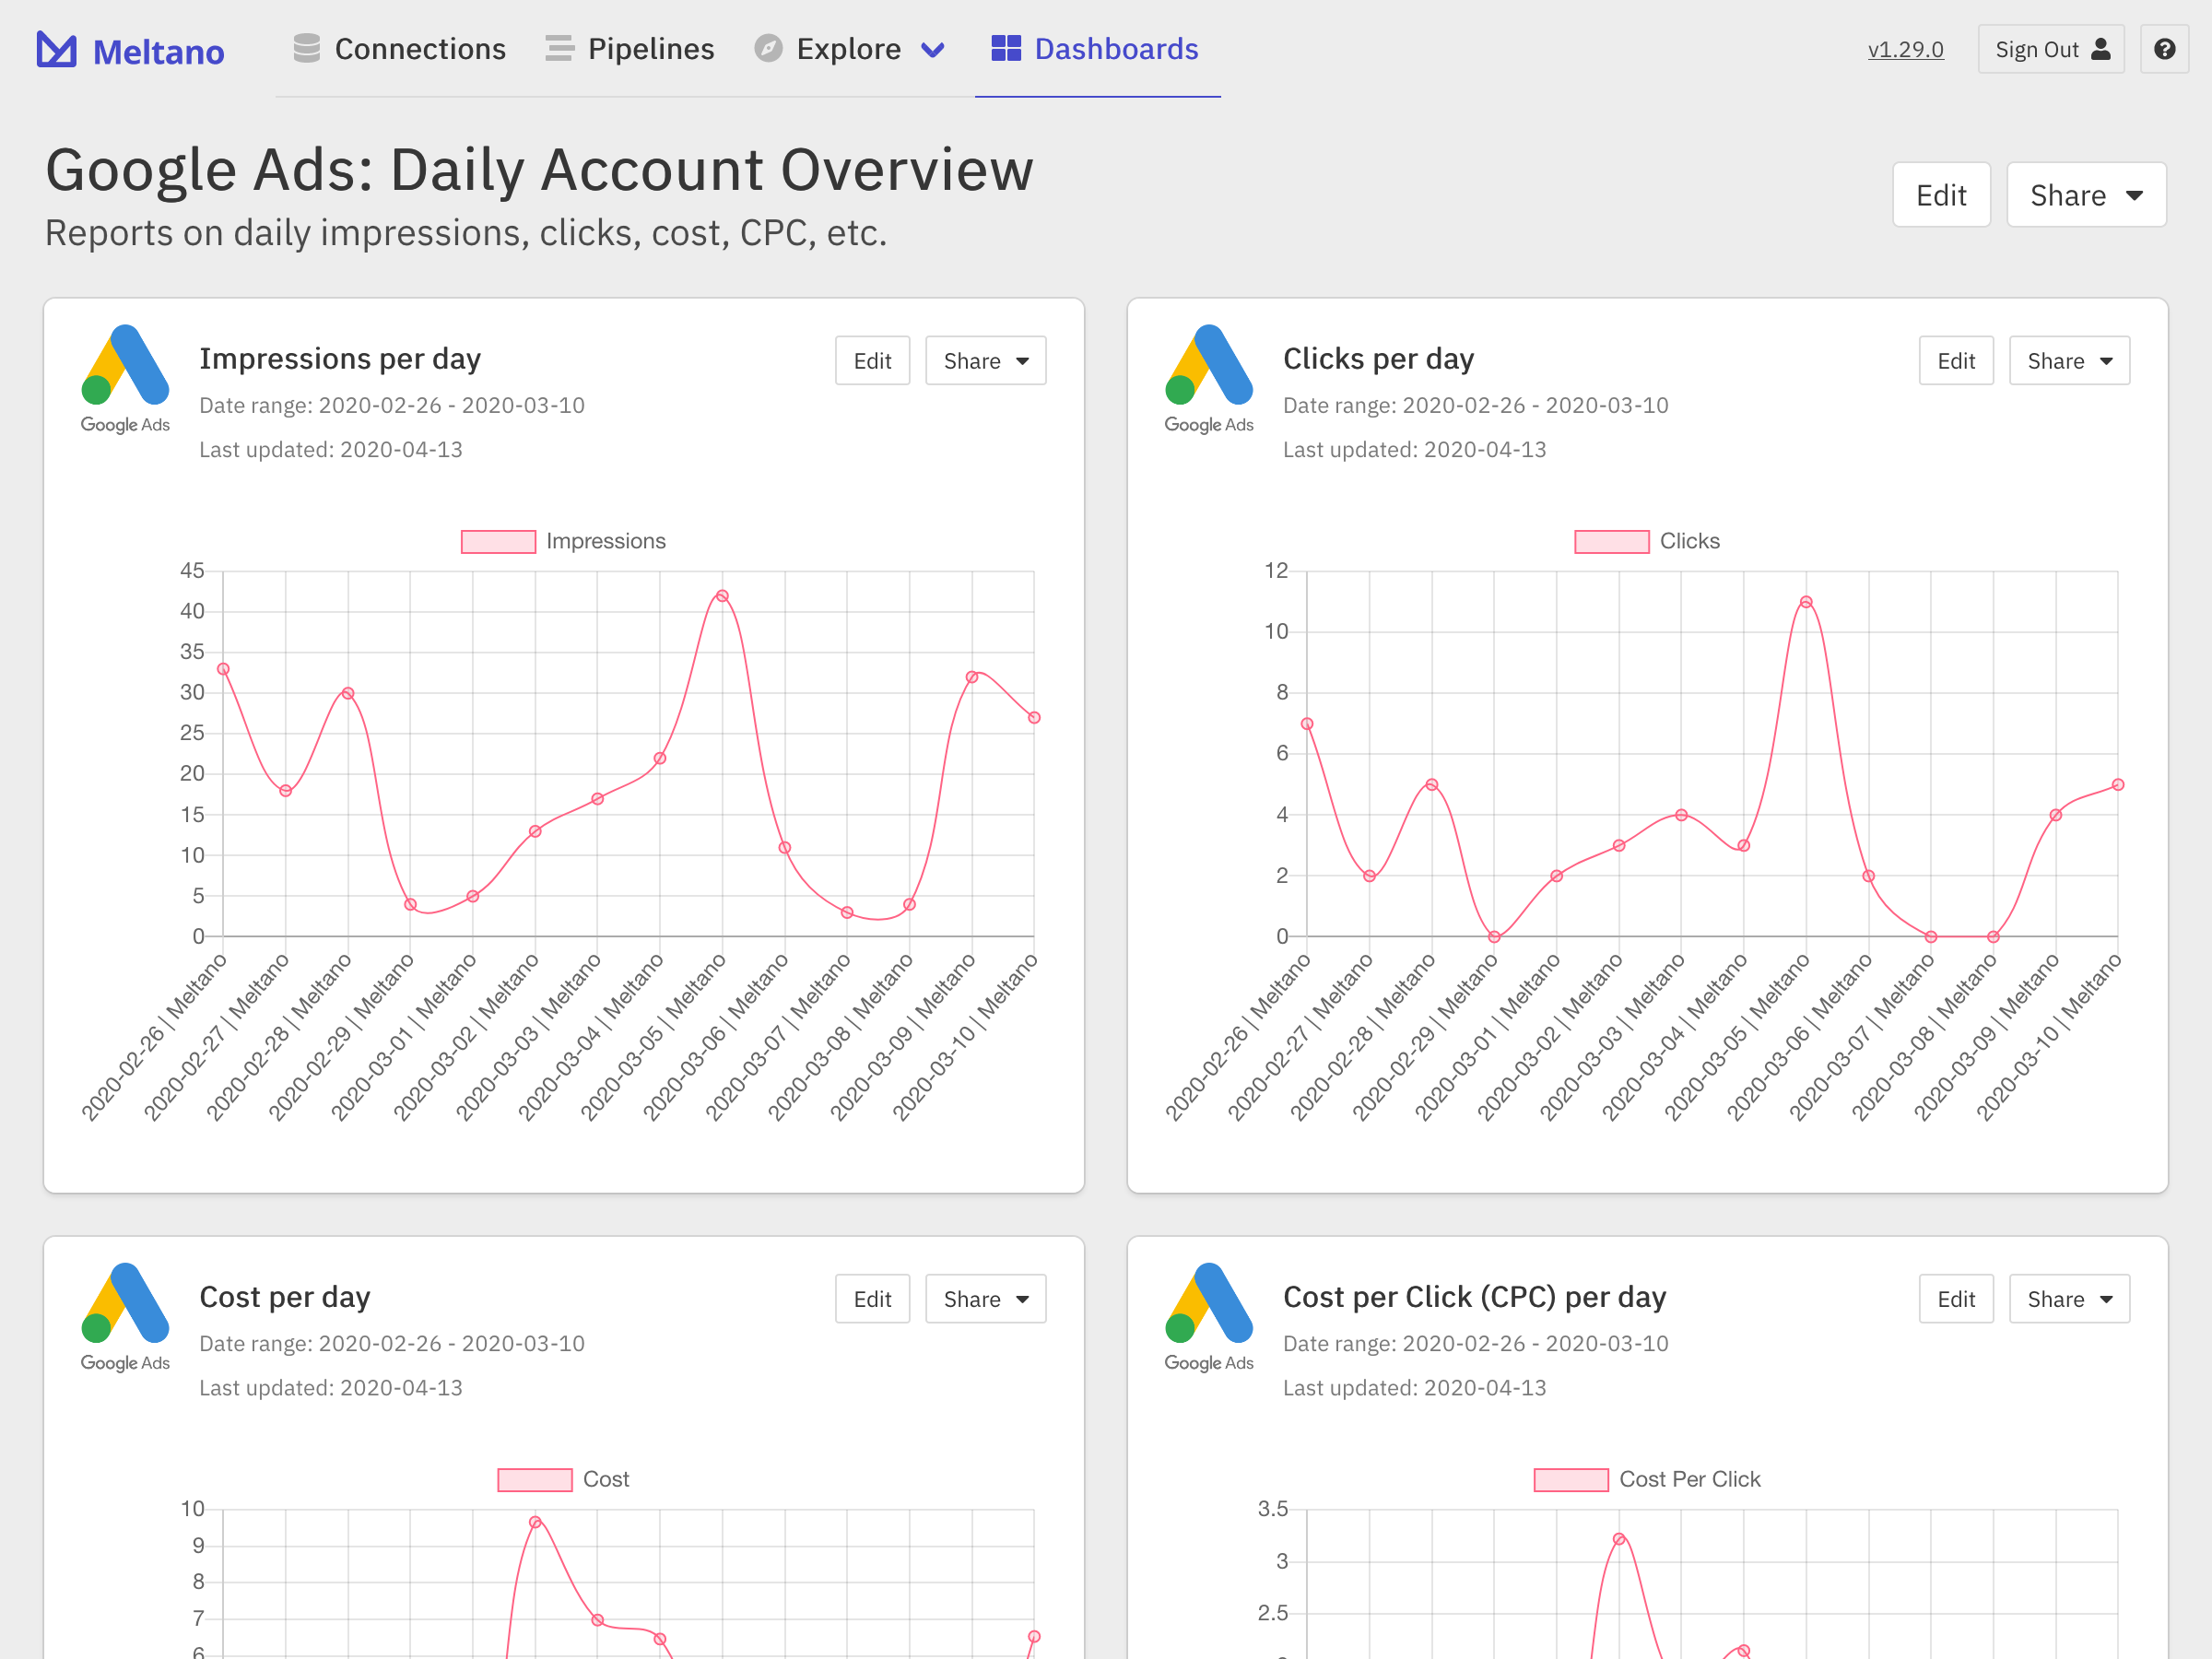
On the Explore page for the data source in question, you will find all of the Dashboards, Reports, and Report Builders that come with it out of the box. How to use these will be covered in more detail in the next section.
On the Pipelines page, you can see the pipeline that was automatically created for the data source you have added. You can modify its update interval to ensure the data in your dashboards and reports is always up to date, trigger a manual run, or access the log for the latest update run to troubleshoot potential issues.
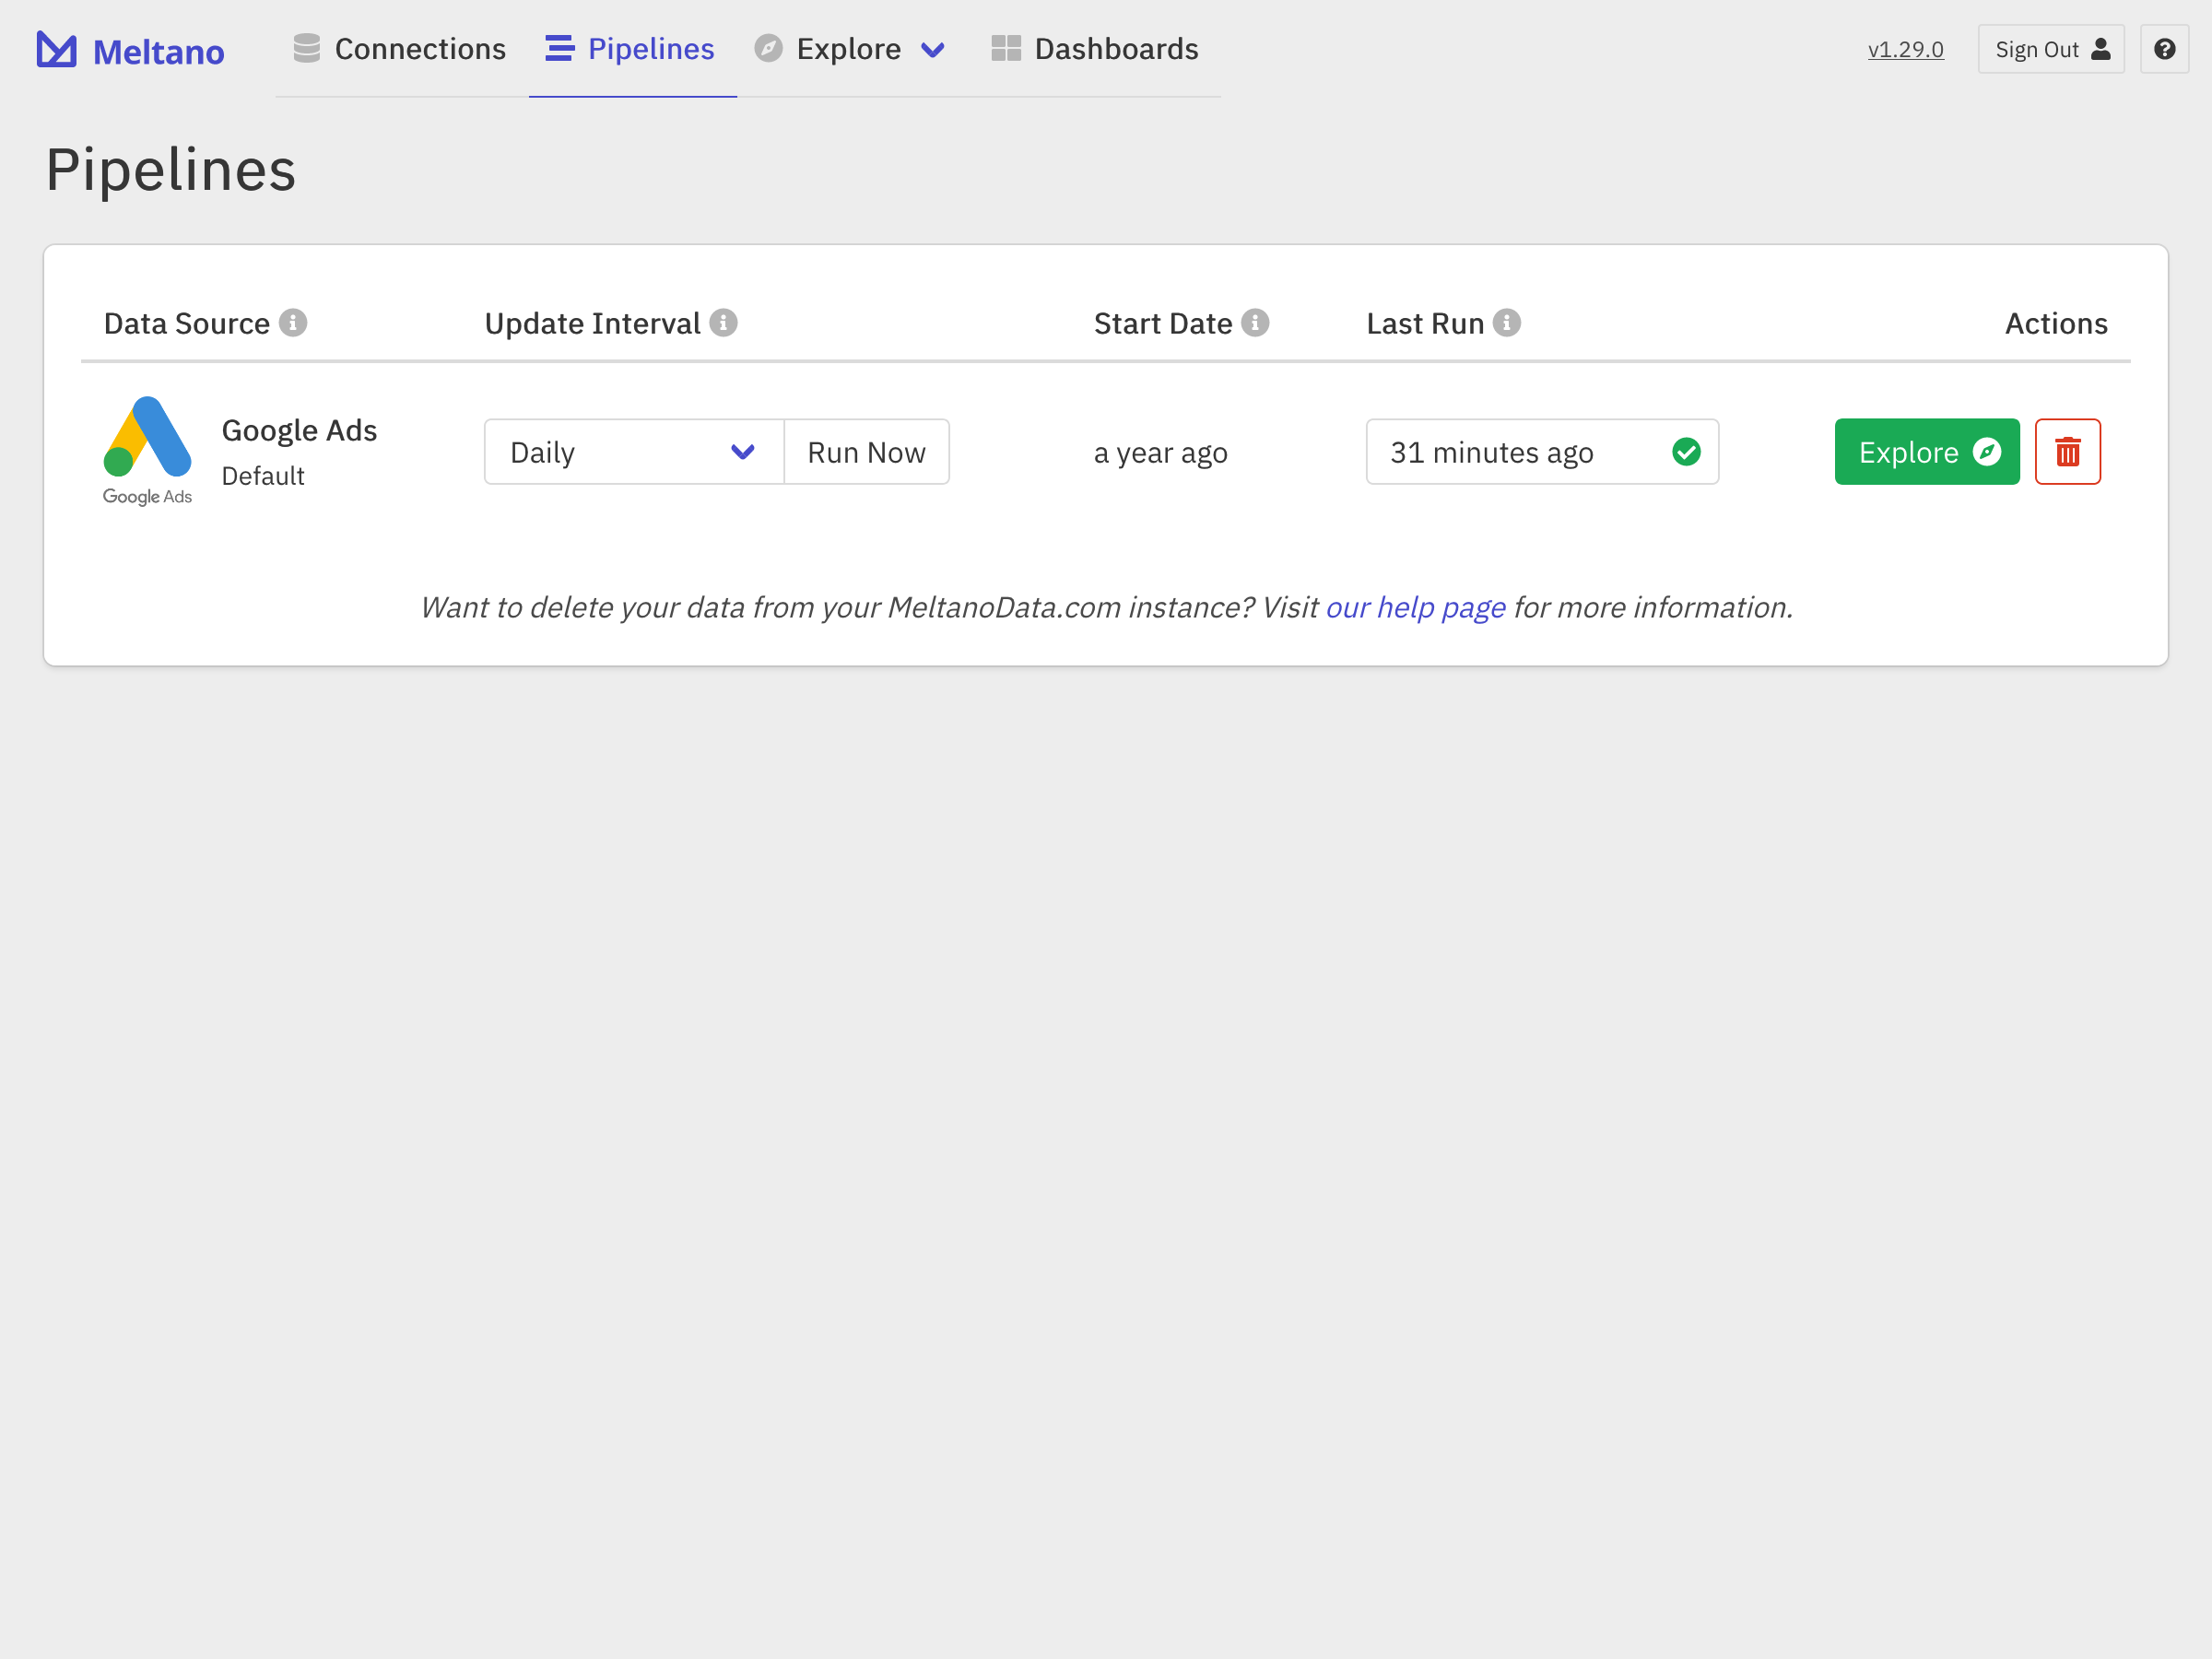
In this example, we have used Google Ads, but the process looks the same for all of the supported data sources.
Explore Your Data #
Congratulations! Now that you have connected a data source and successfully imported the initial dataset, we are now ready to explore and analyze the data!
On the Explore page for the data source in question, you will find all of the Dashboards, Reports, and Report Builders that come with Meltano out of the box. Once you start creating your own reports and dashboards, they will show up here as well.
To help you get started, the Meltano team has used the report builders to build a number of reports for common metrics and dimensions, that can be found on the dashboards.
Of course, these may not be the exact reports you’re interested in, and you can dig deeper into your data by using the Report Builder, which allows you to dynamically build queries and visualize your data. You can access it either by choosing a specific Report Builder on the Explore page, or by hitting the “Edit” button on an existing report.
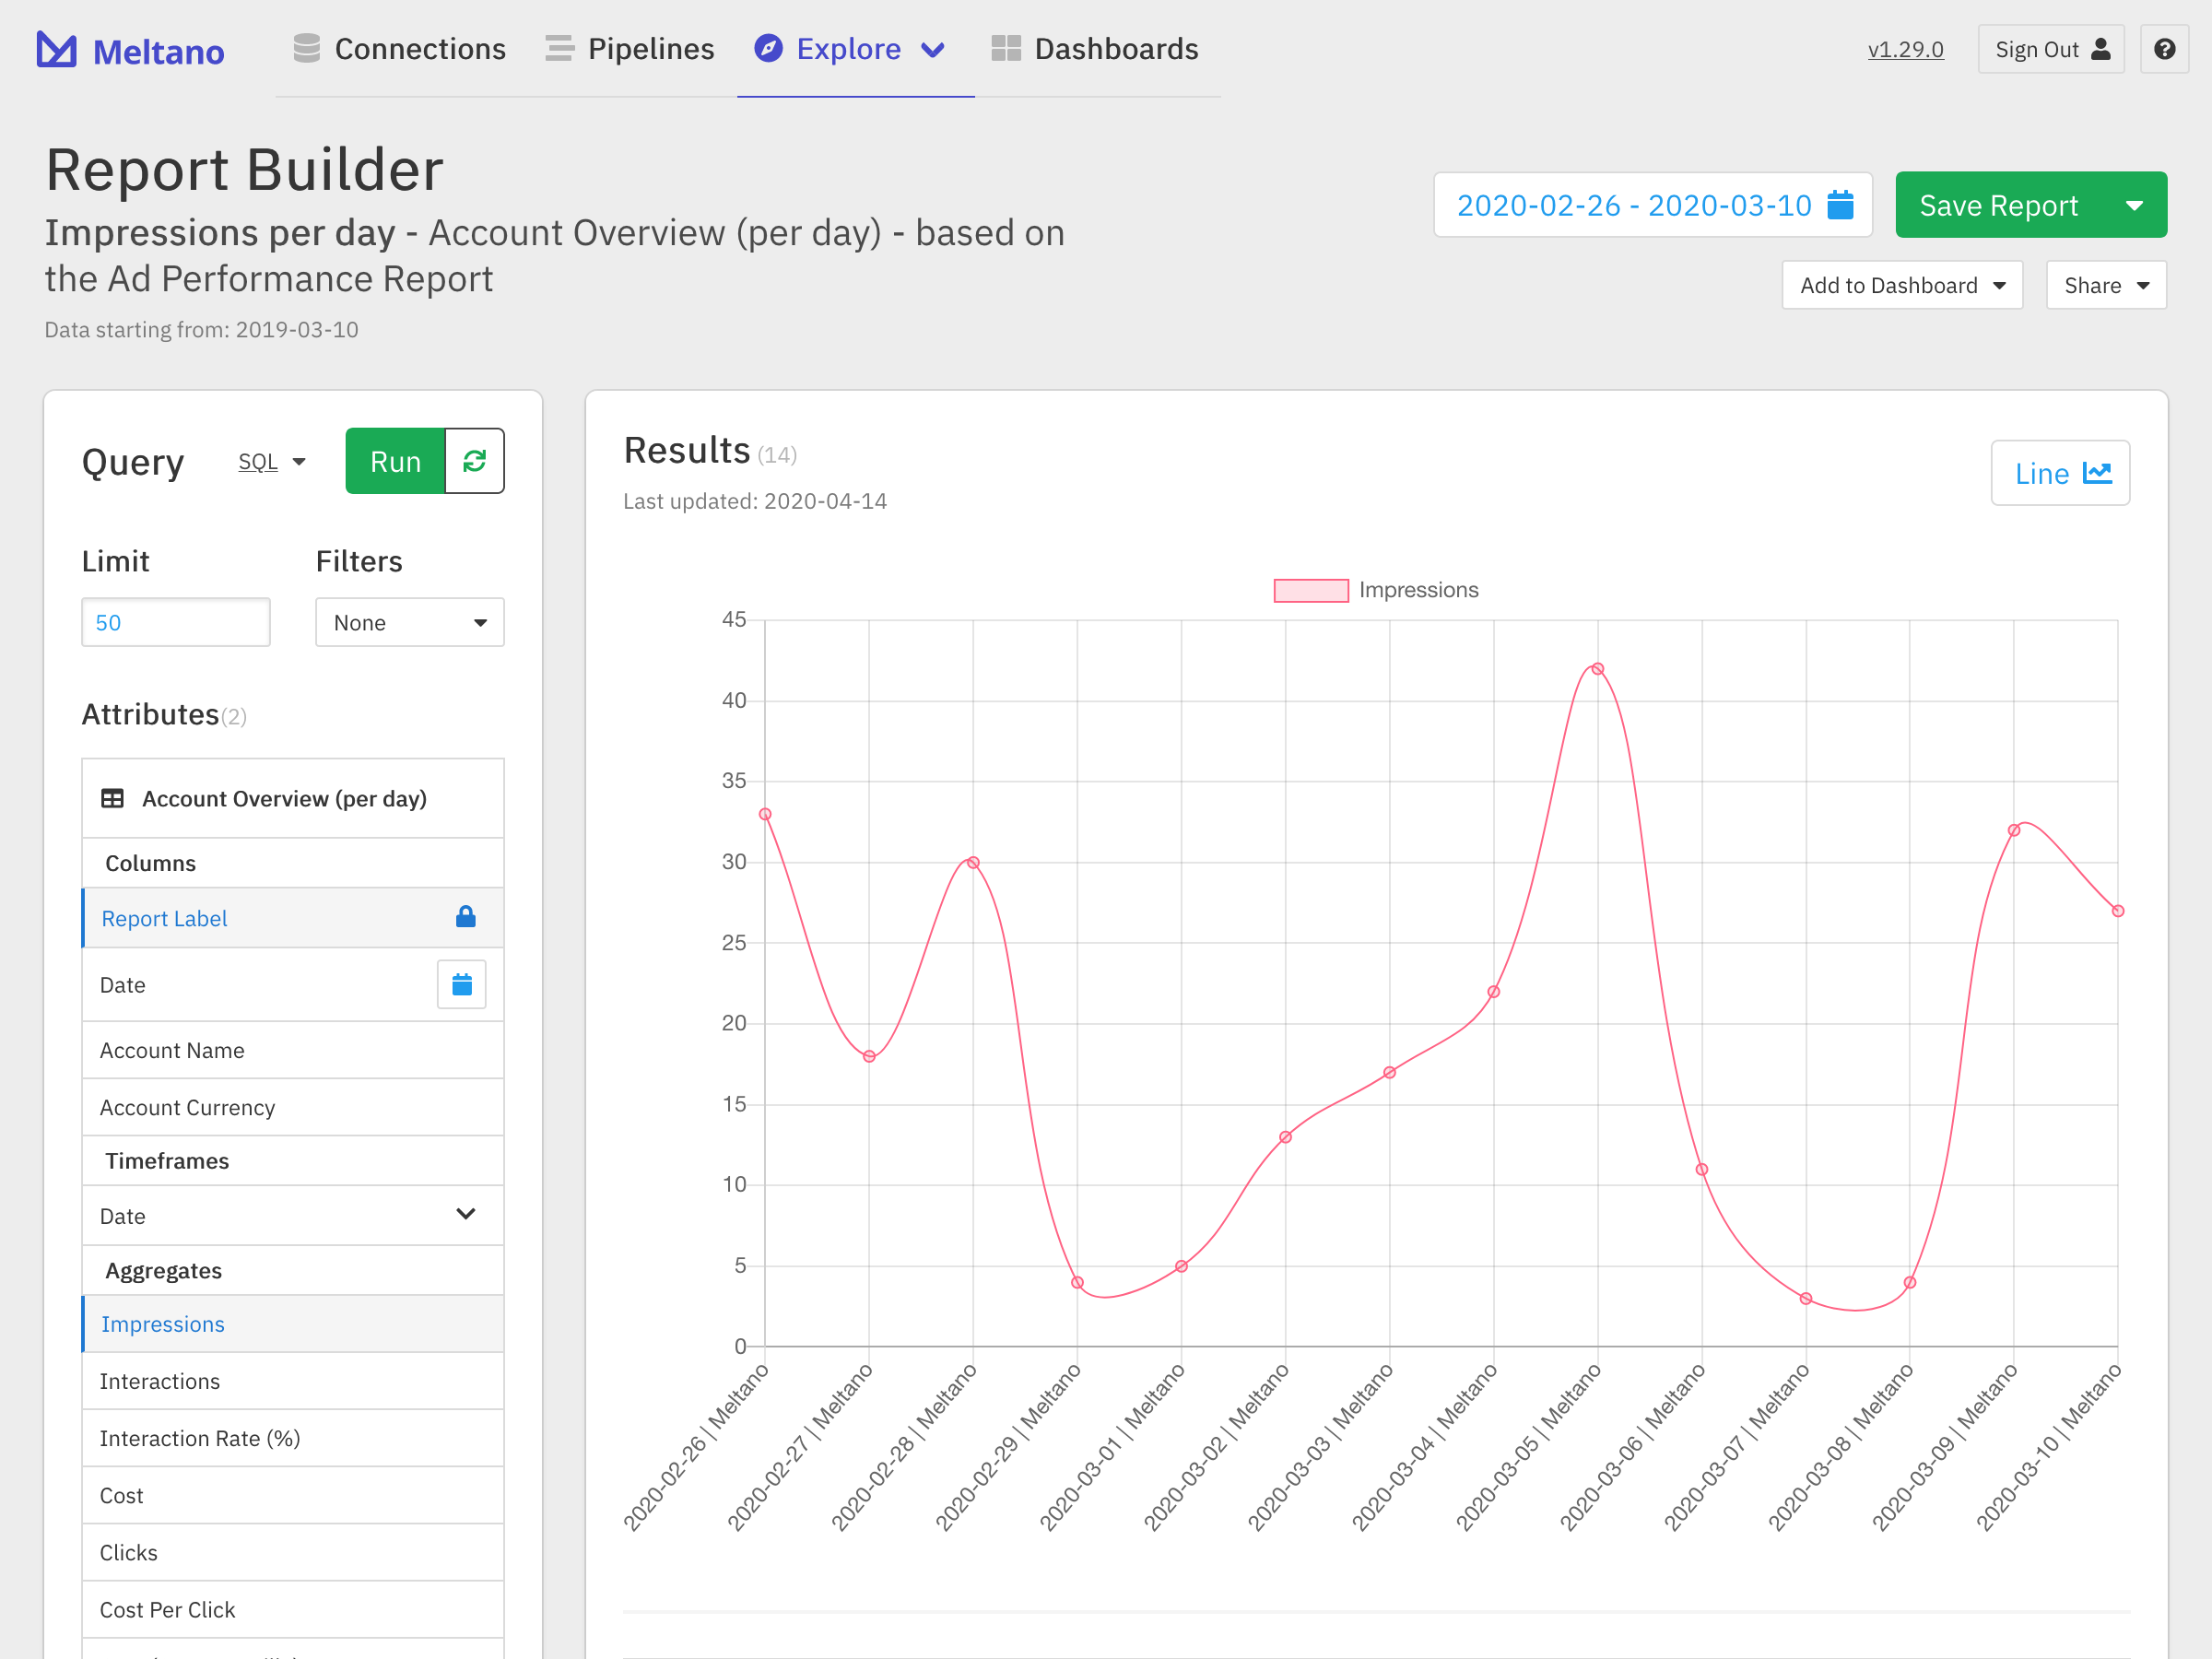
In the Query panel on the left, you can select the columns (dimensions) and aggregates (metrics) you would like to show in the table and graph. You can also specify a limit (the maximum number of rows/data points), set one or more filter, or view the generated SQL for the query in question.
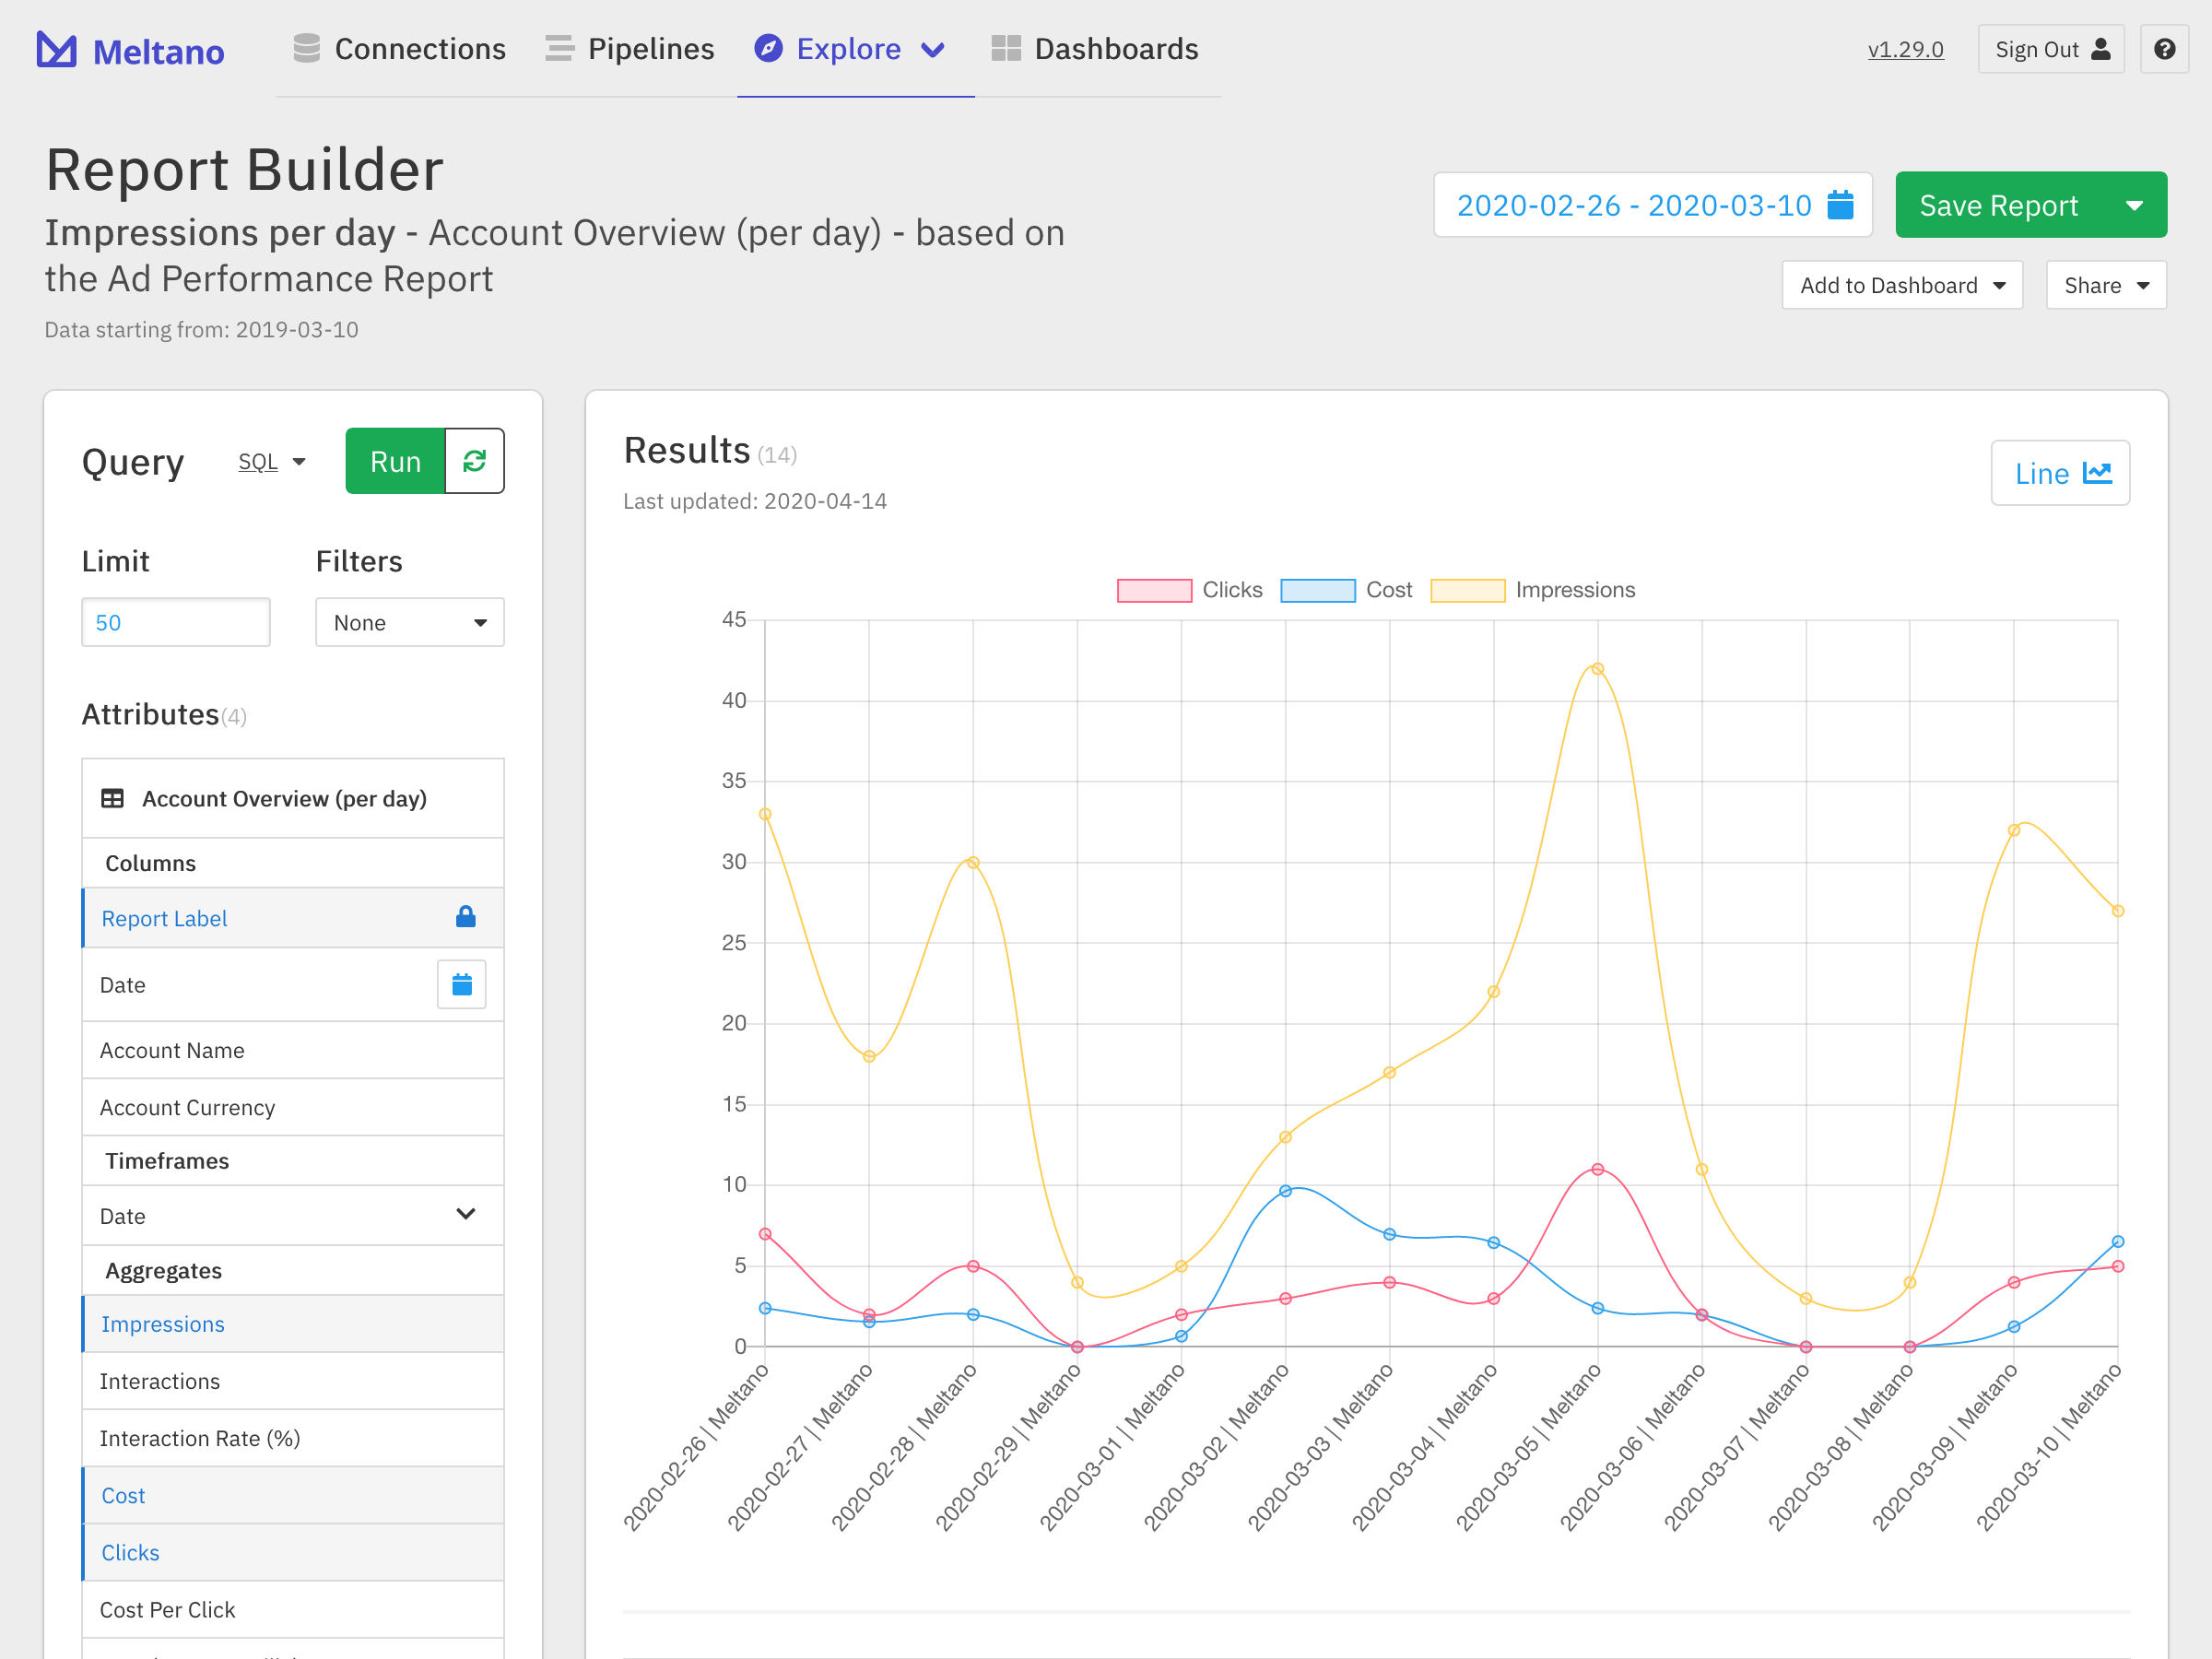
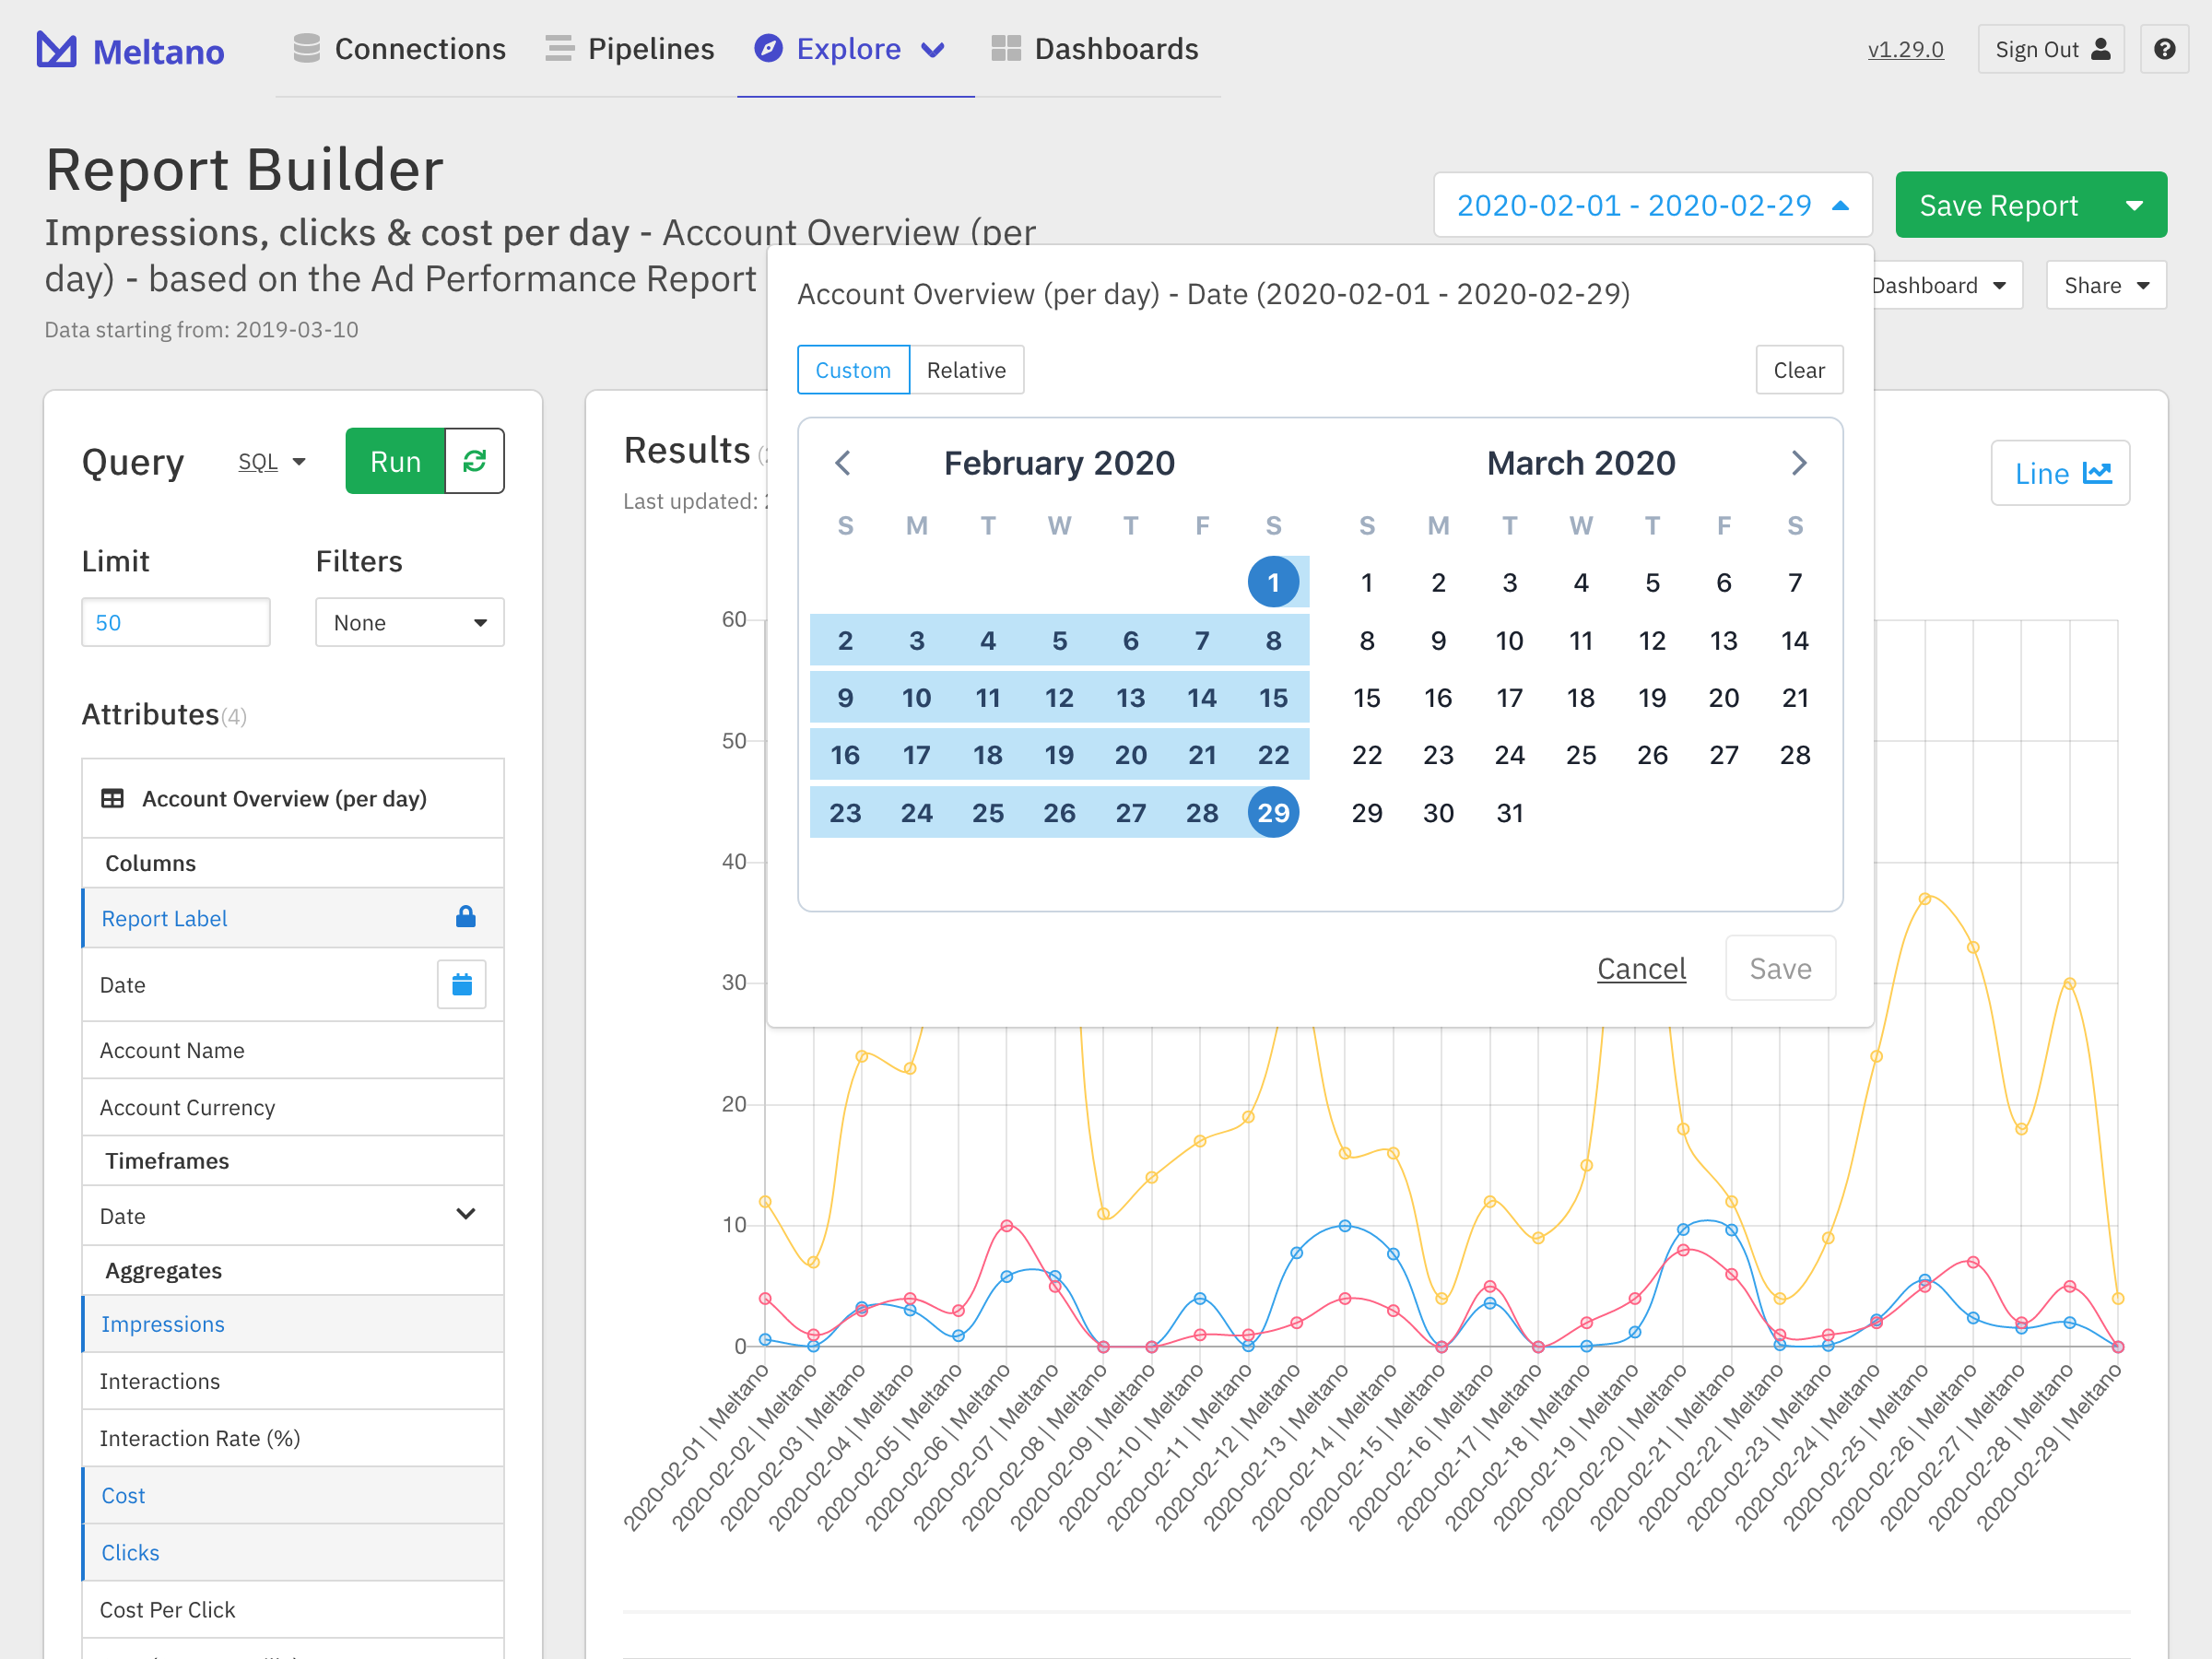
You can also change the date range using the date picker in the top right.
Additionally, you can change the chart type using the button on the top right of the chart, and change the sorting of your data using the header cells in the table below the graph.
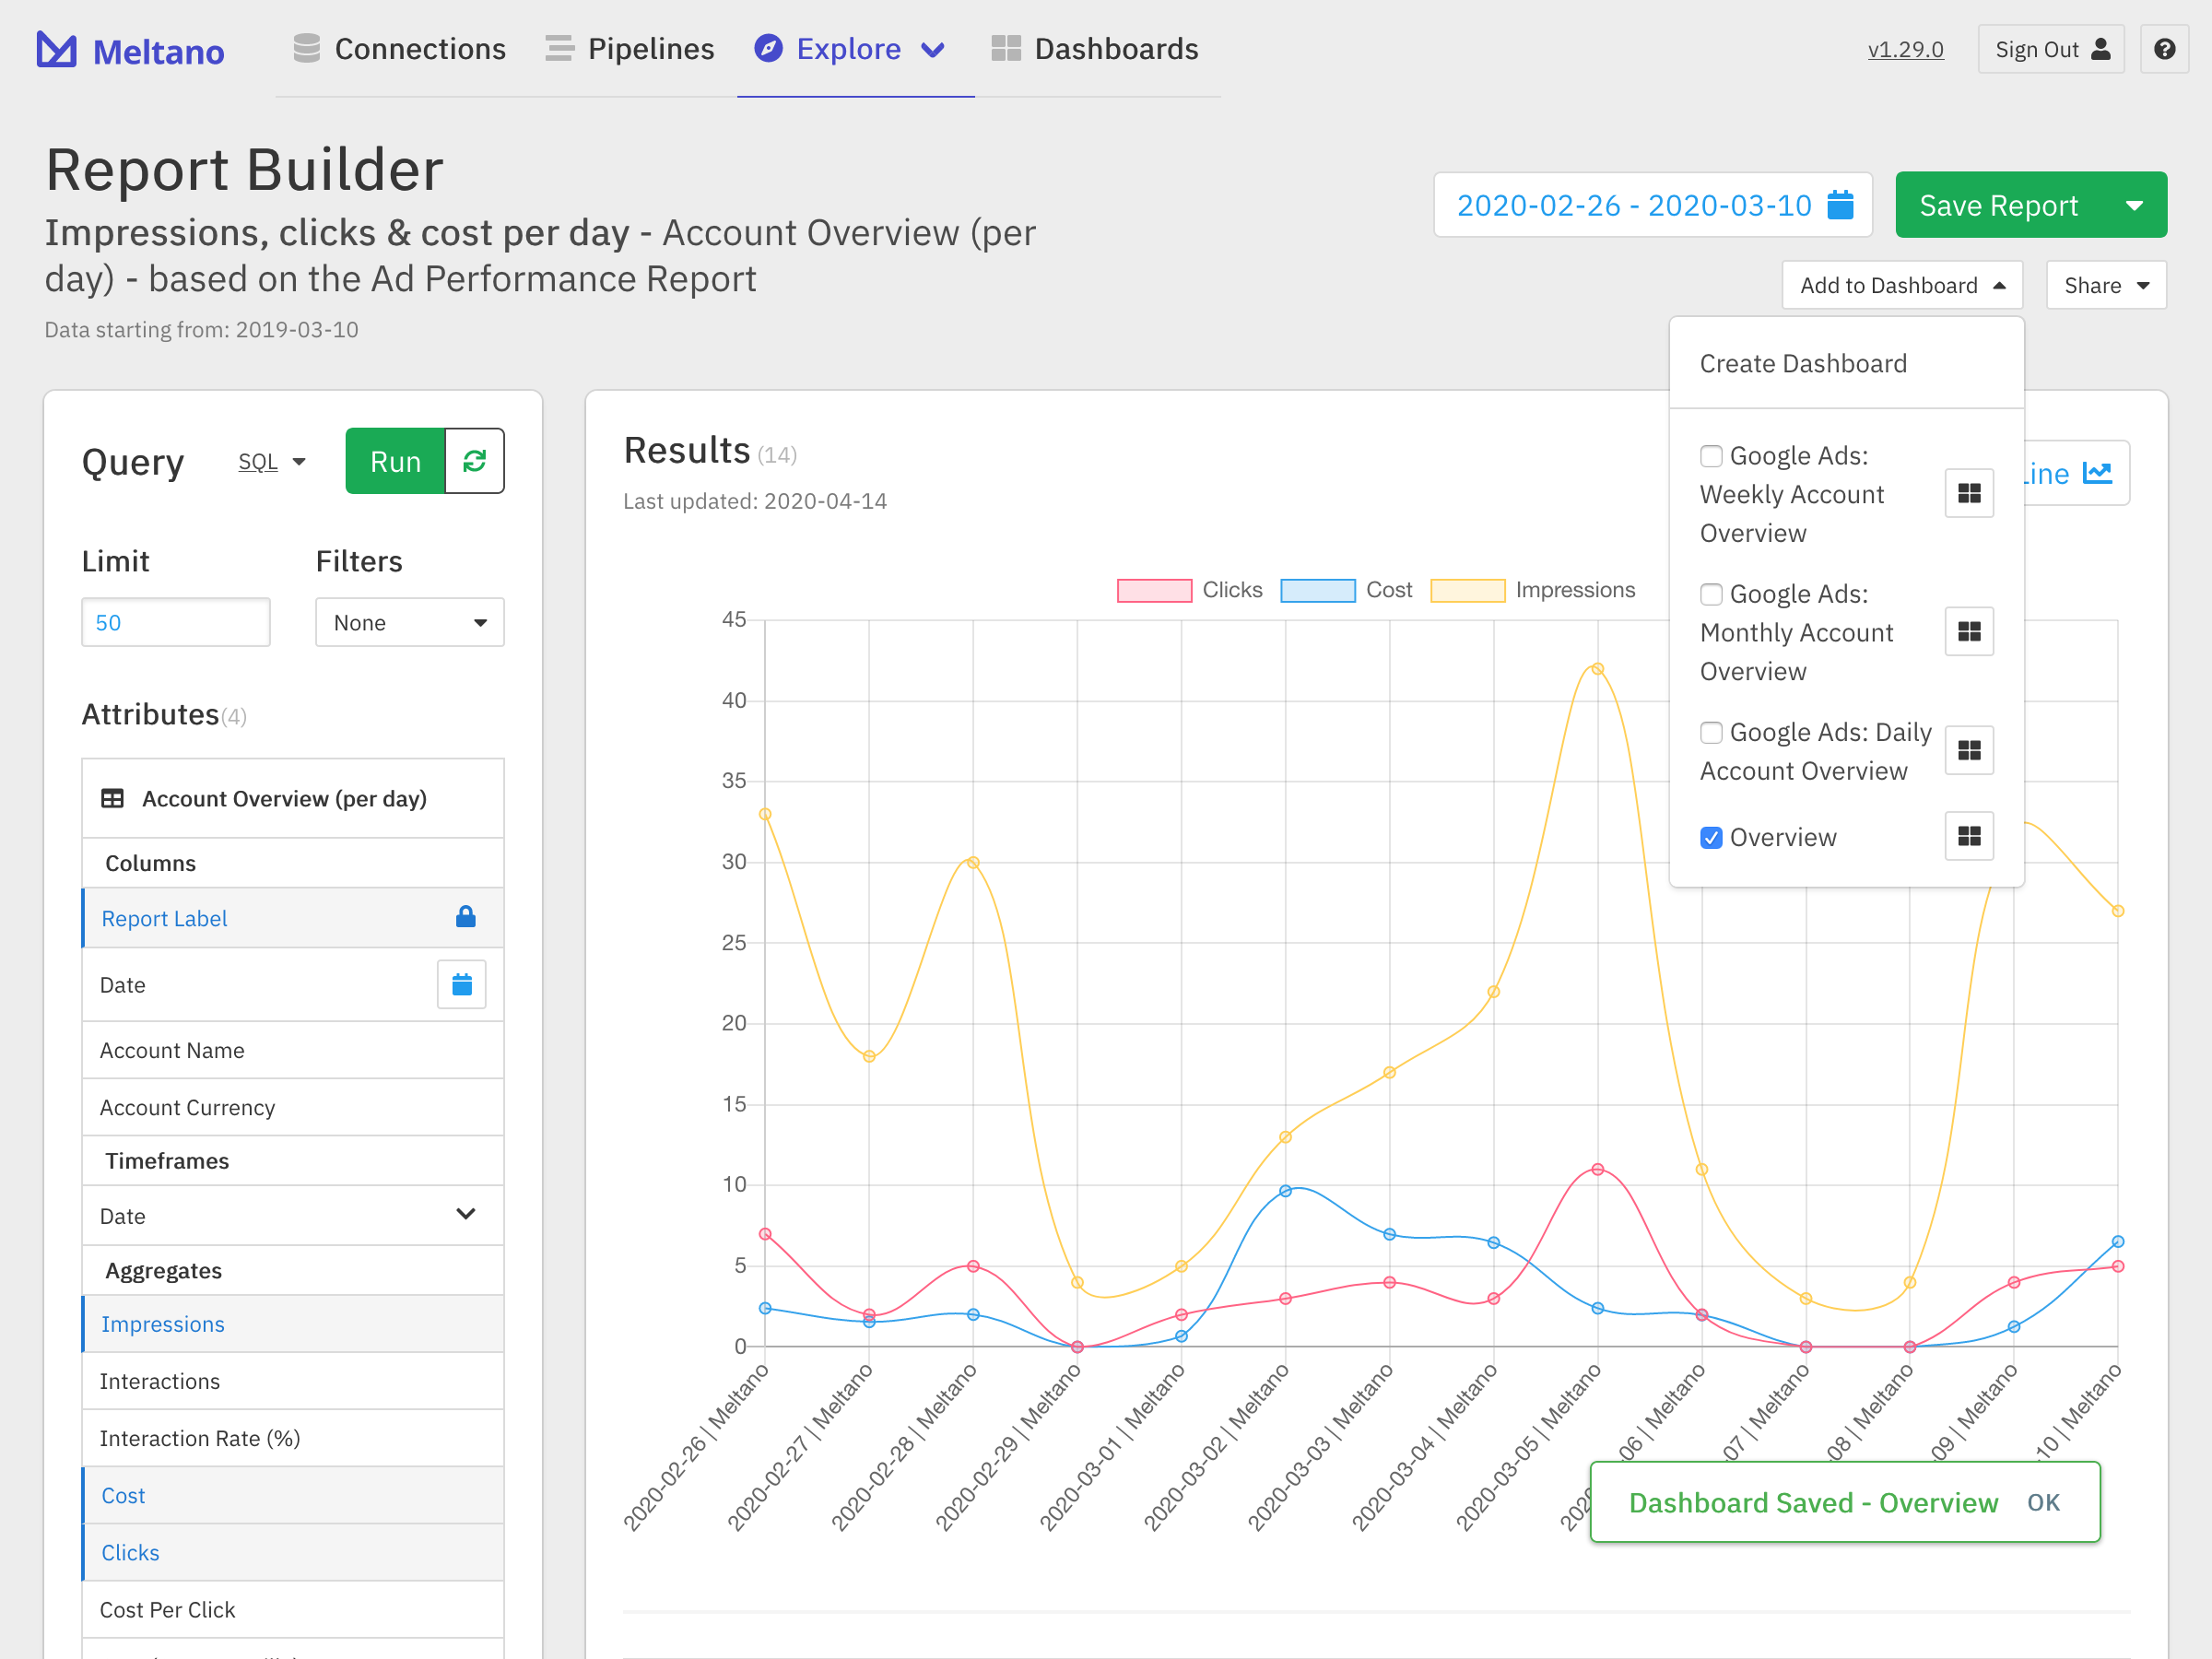
Save Reports #
When we find an analysis that we want to reference in the future, we can easily do this by saving the analysis as a report using the Save Report button in the top right.
Note that if you are editing an existing report, clicking “Save Report” will update the report in question. To create a new report with the changes, click the arrow to the right of “Save Report”. In the dropdown that will open up, you can choose a new name for the report.
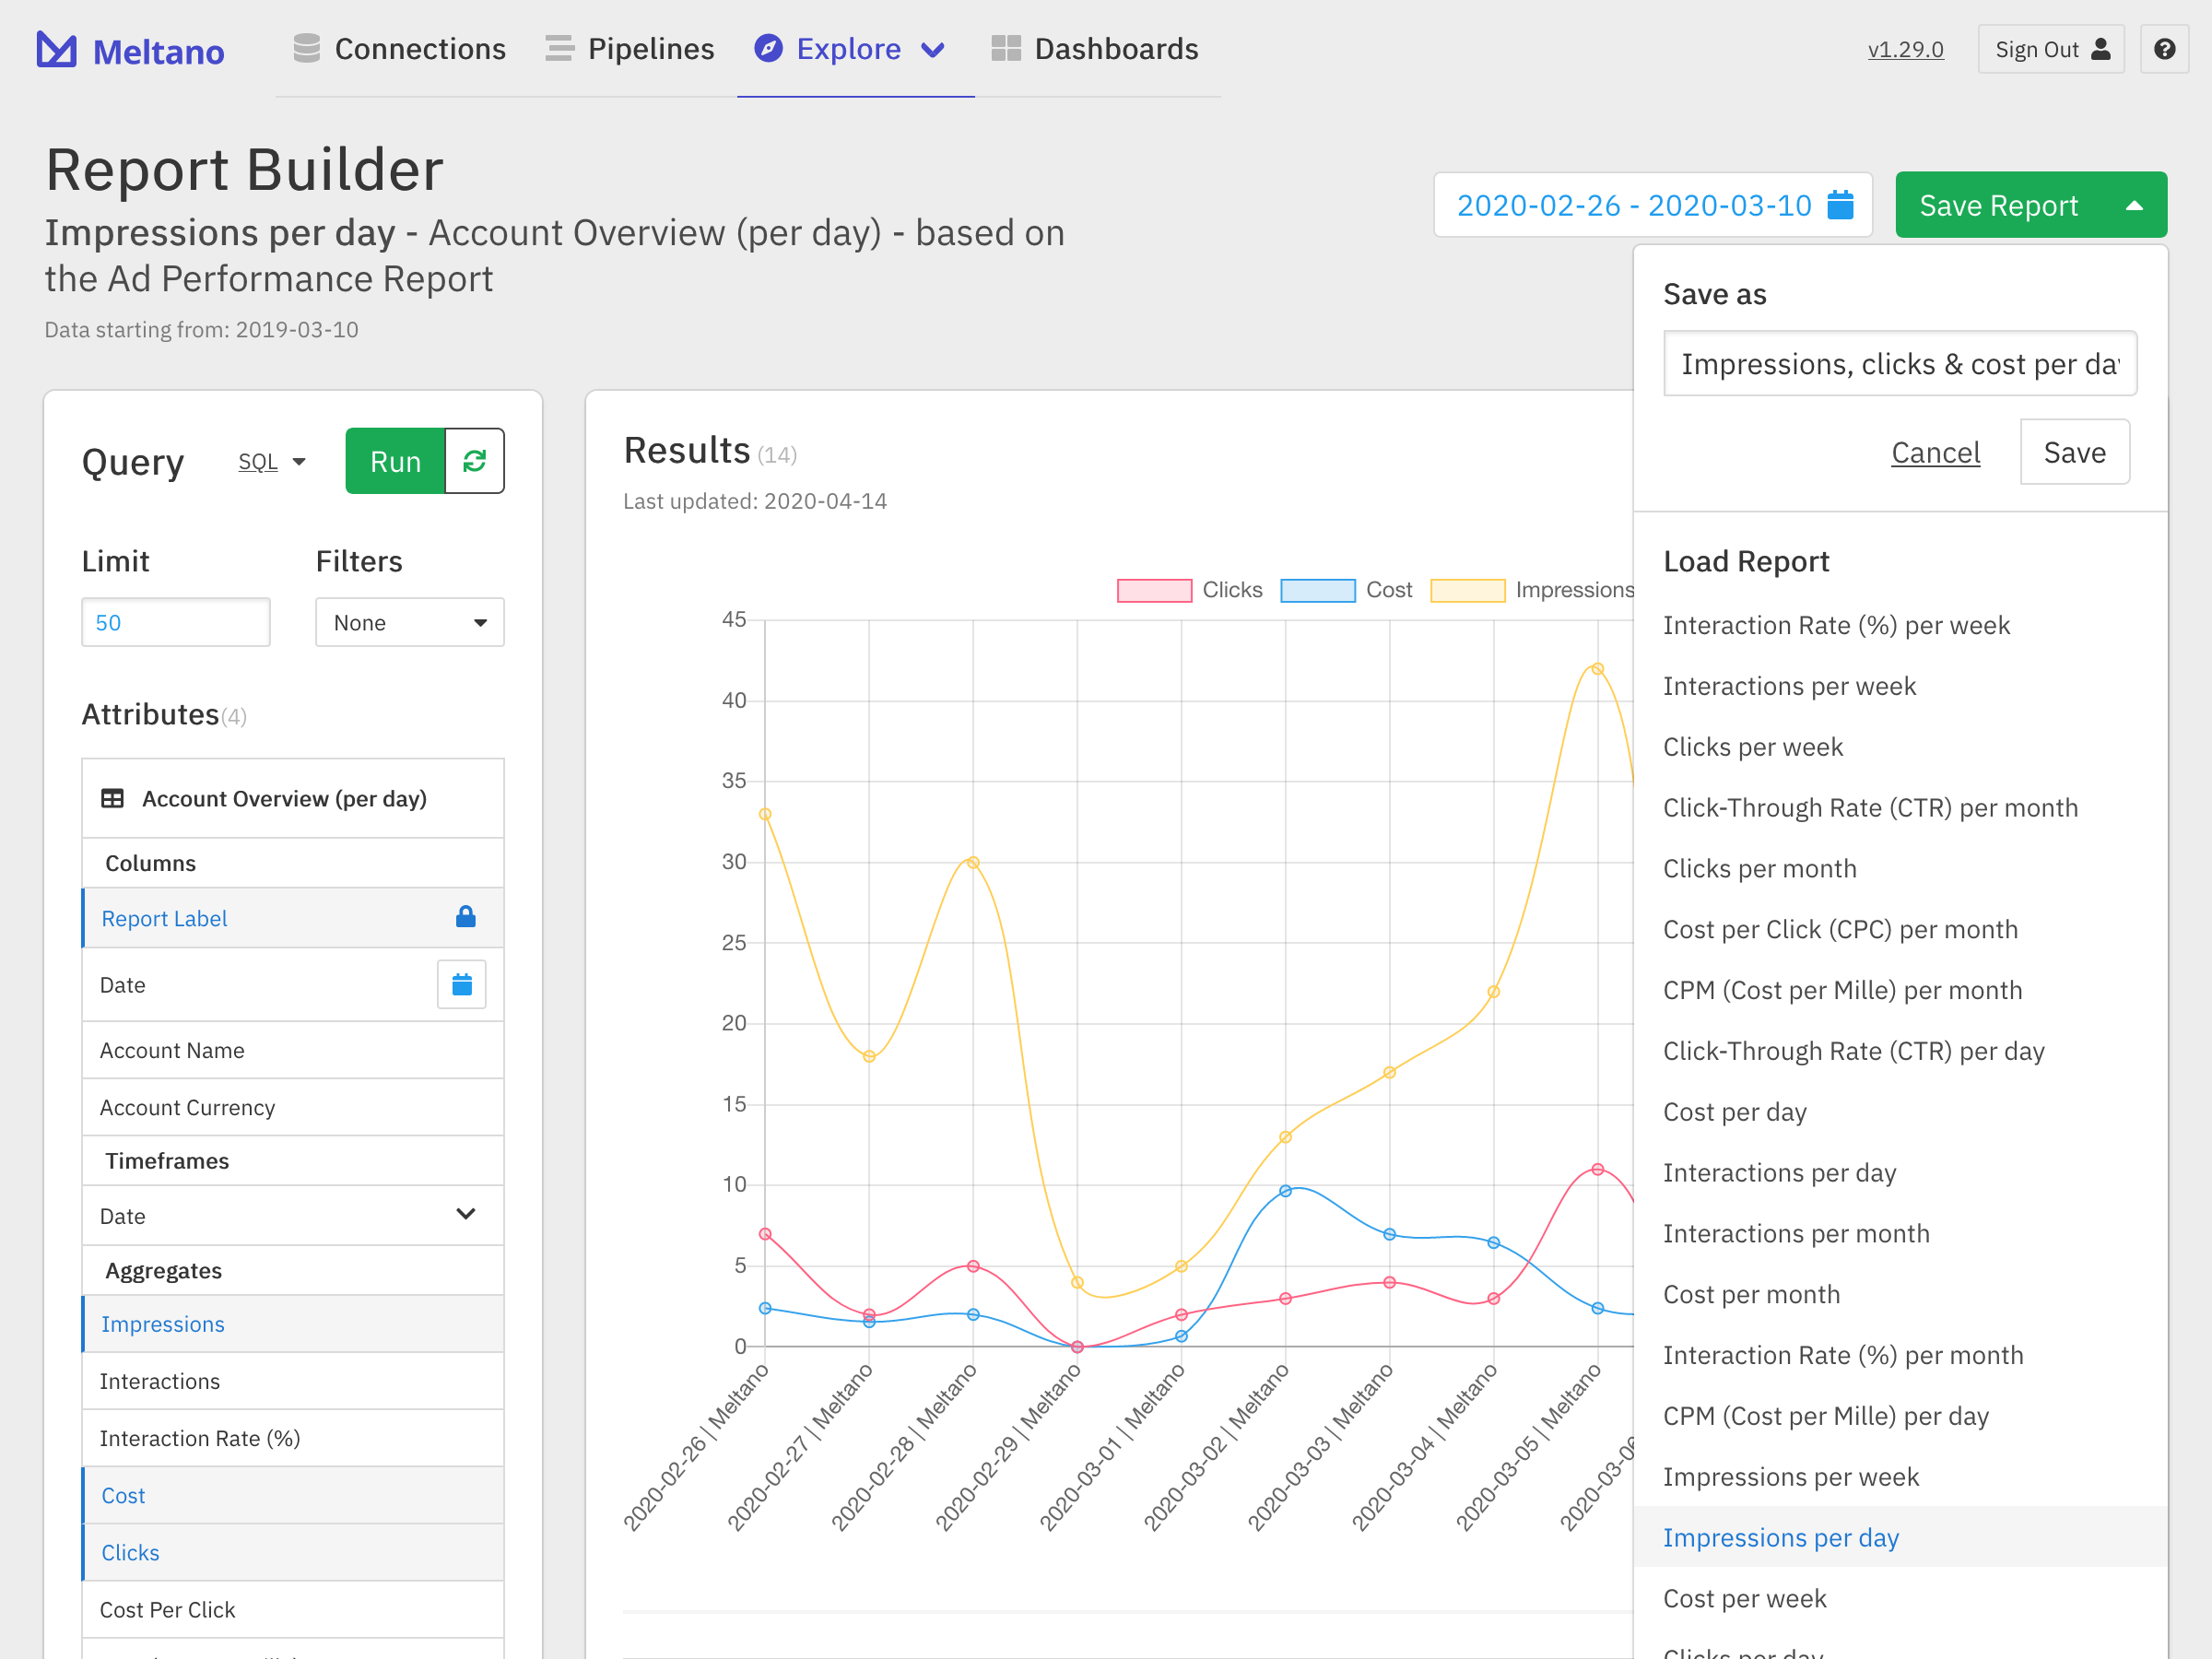
Once we click Save, you should see the new name reflected in the top left of the report builder interface, and our analysis has been saved!
You can now find the report on the “Explore” page for the data source in question.
Add Reports to Dashboards #
As you acquire more reports, you will probably want to organize them via dashboards. This can be done by clicking on the Add to Dashboard button in the toolbar. You will see all existing dashboards listed here, as well as the option to create a new one.
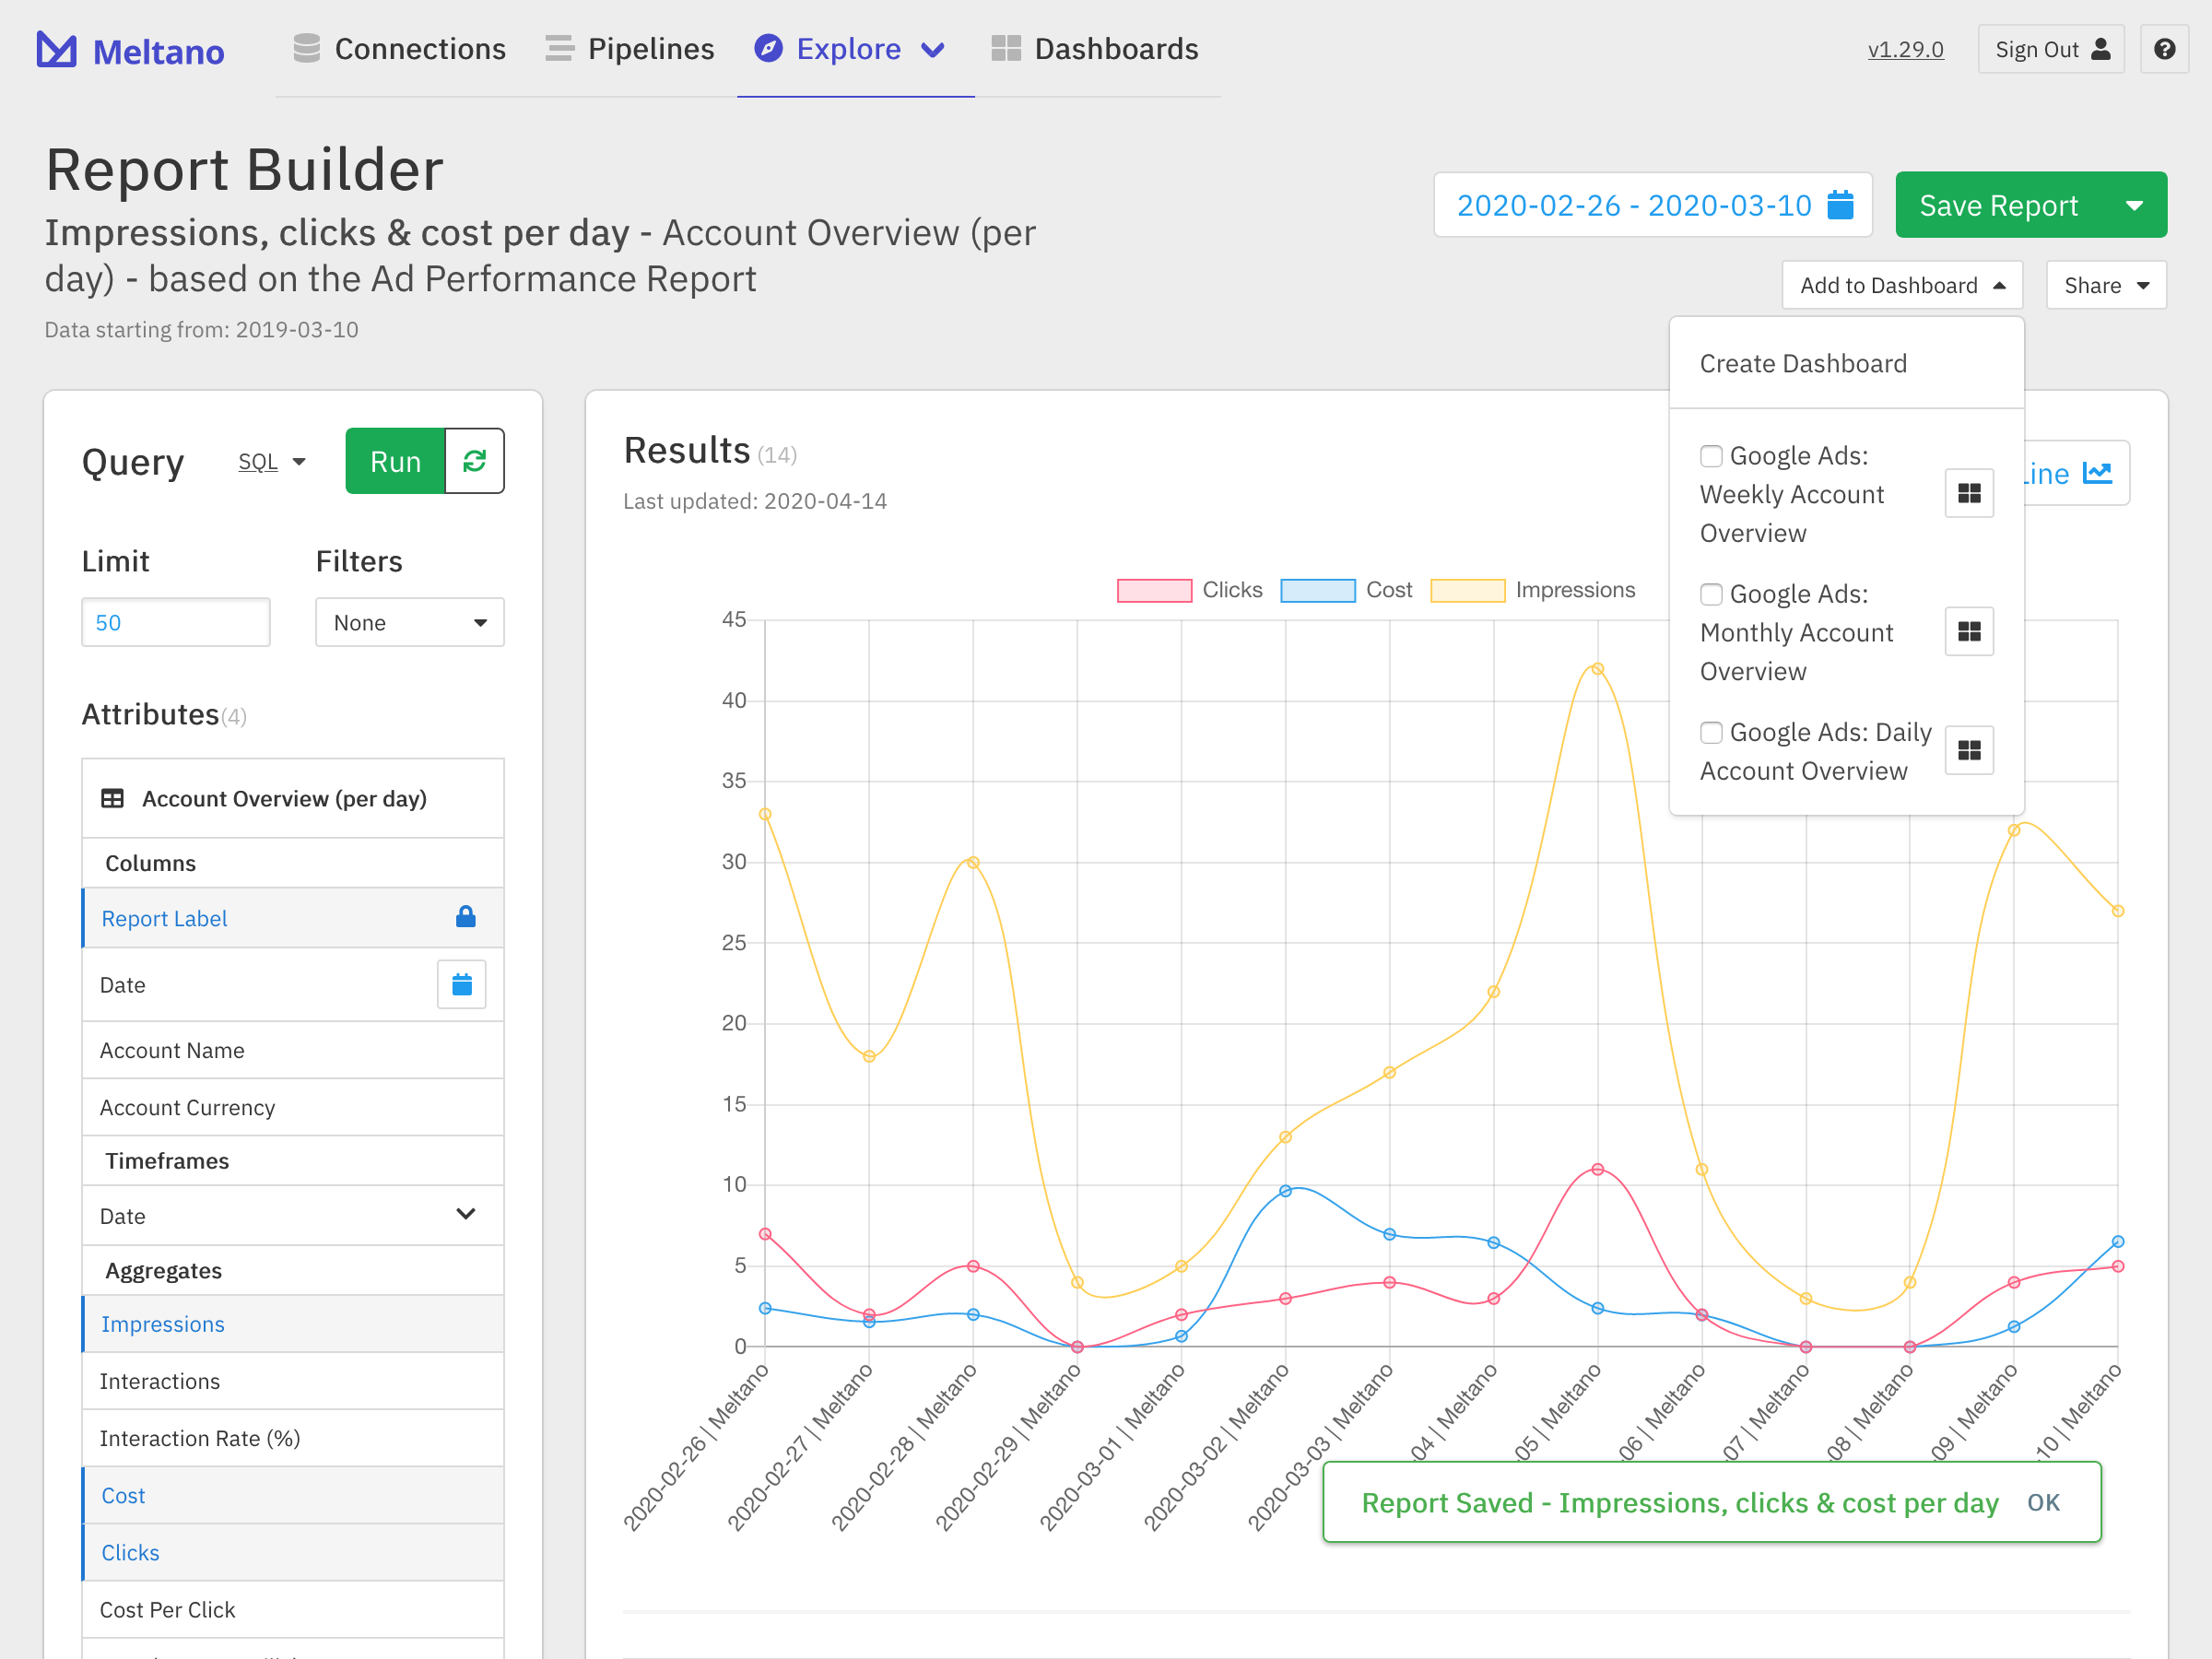
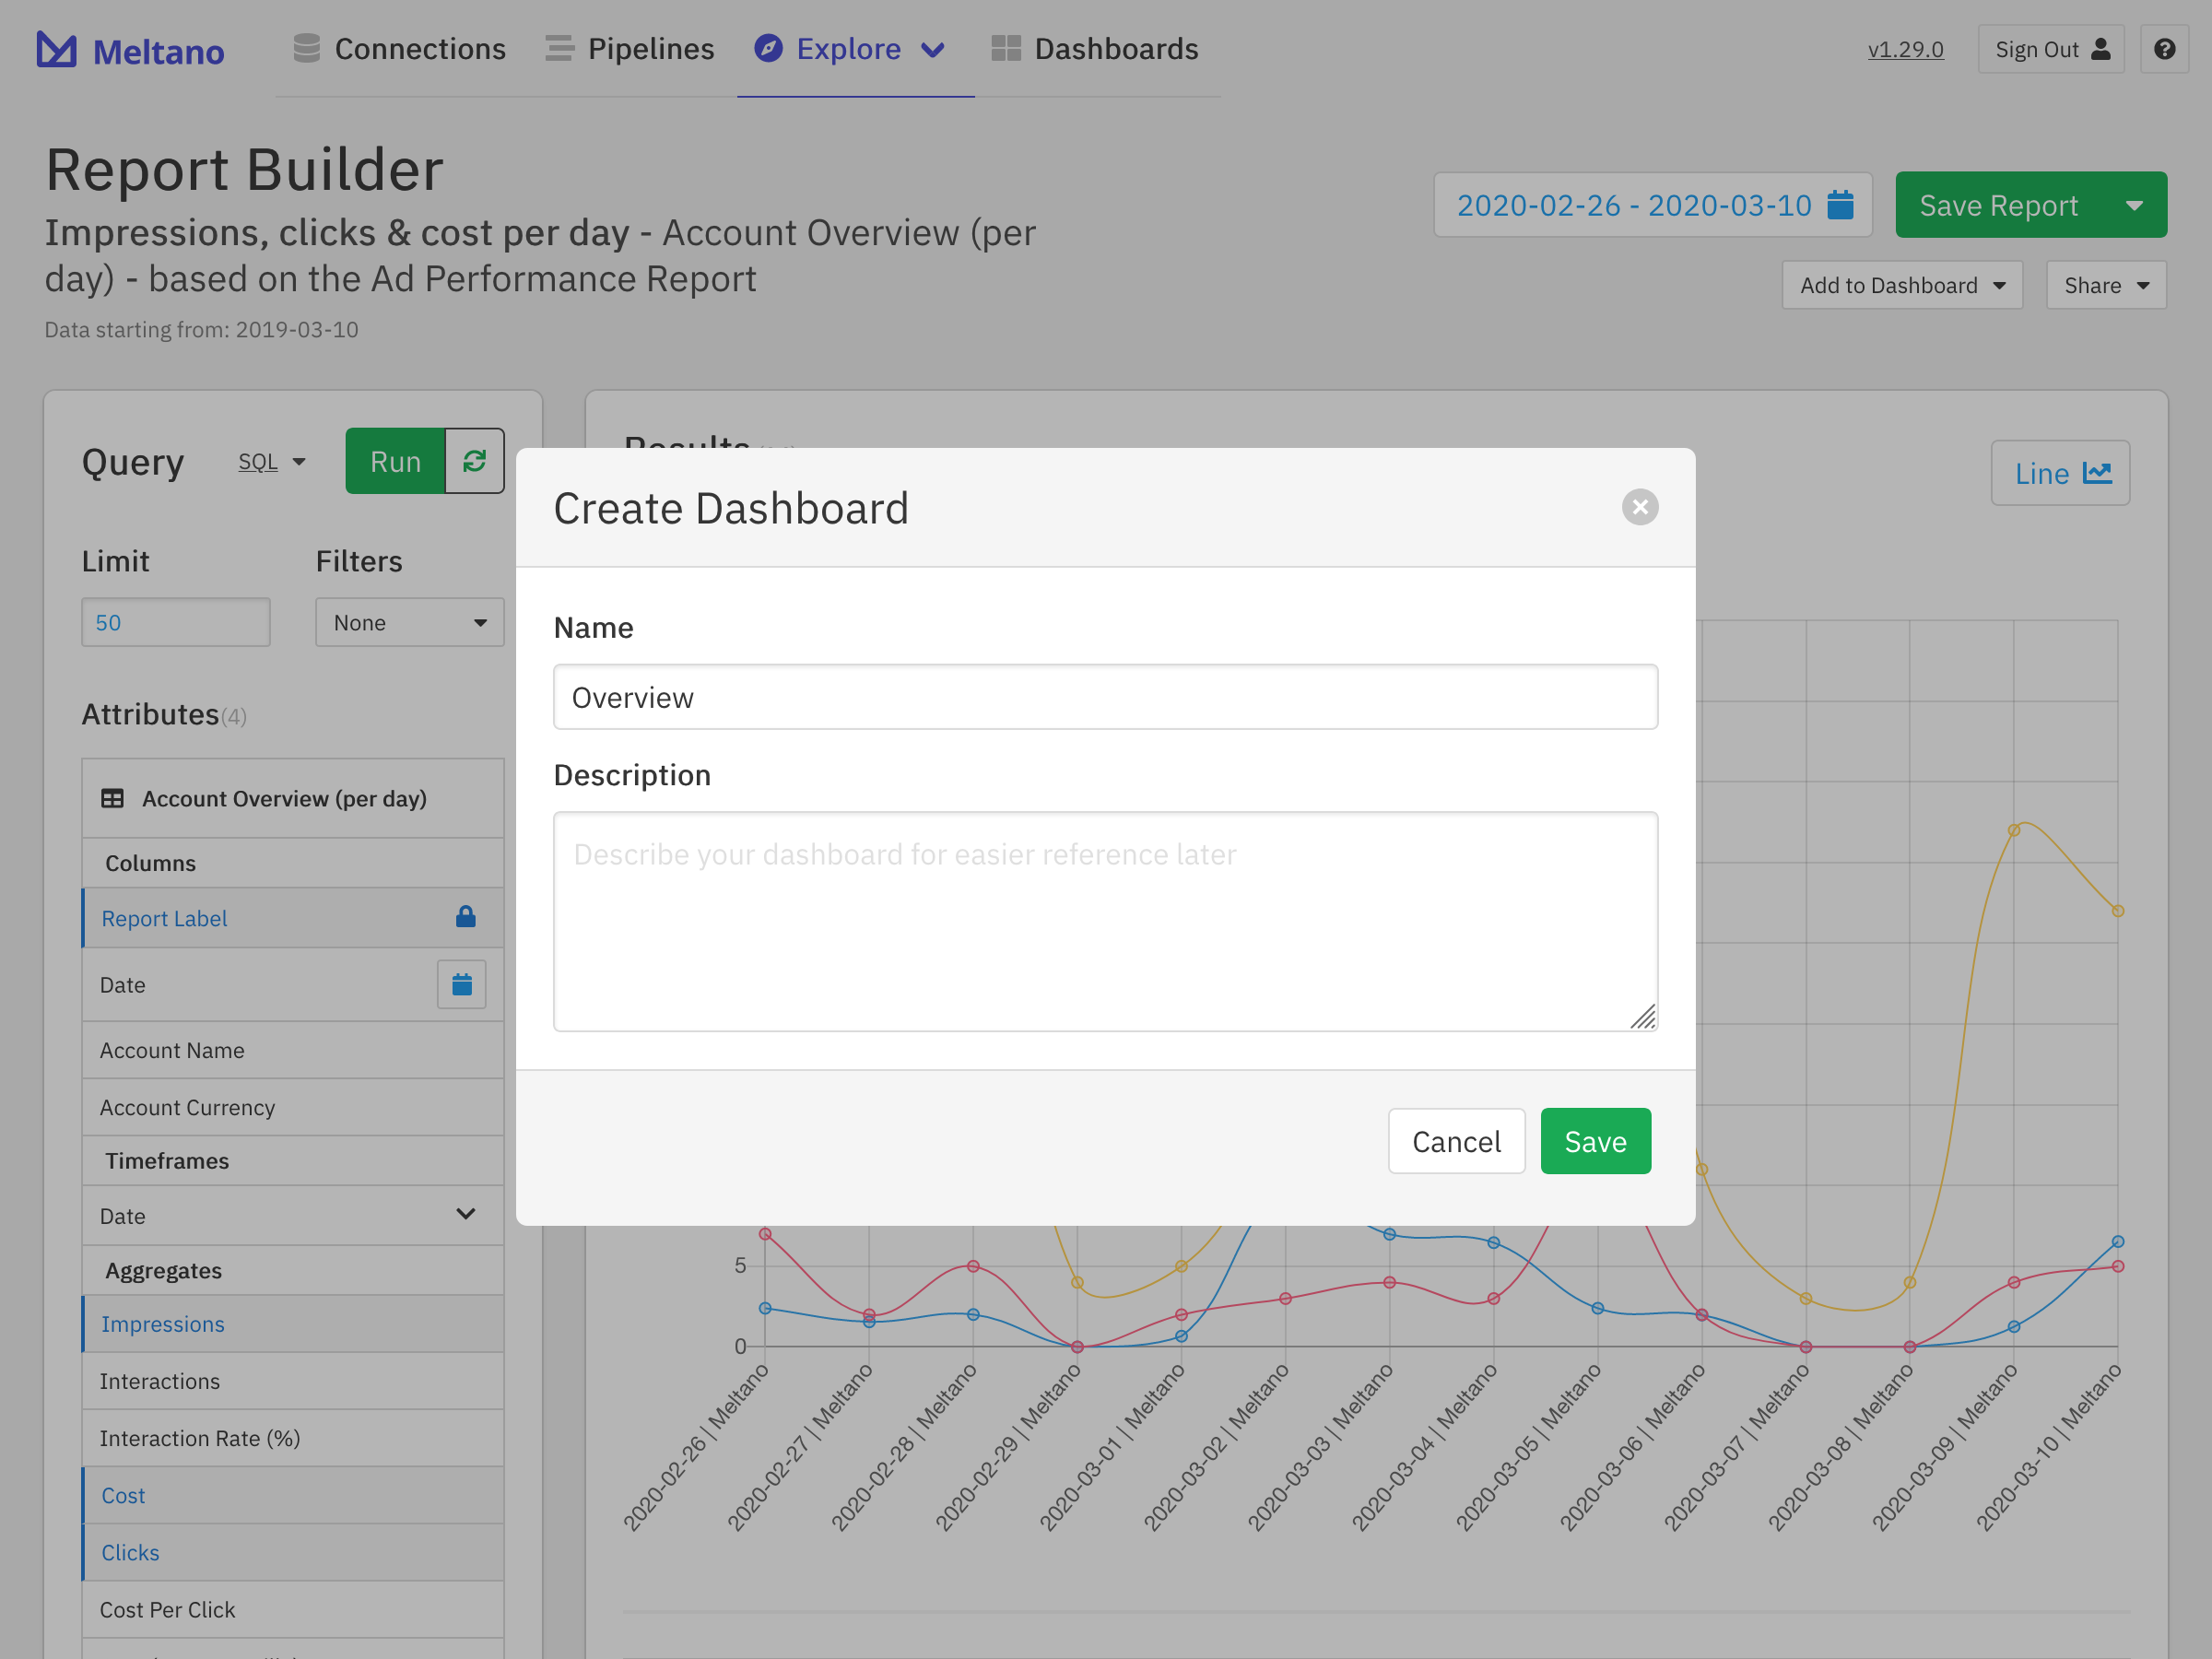
To add a report to an existing dashboard, simply click the checkmark by the appropriate name. To create a new dashboard, click the Create Dashboard button. In the dropdown that will open up, you can choose a new name for the dashboard.
Once we click Create, we can verify that our report has been added to the Dashboard by opening the Add to Dashboard menu.
We can find the newly created dashboard on the Dashboards page you can find in the navigation bar.
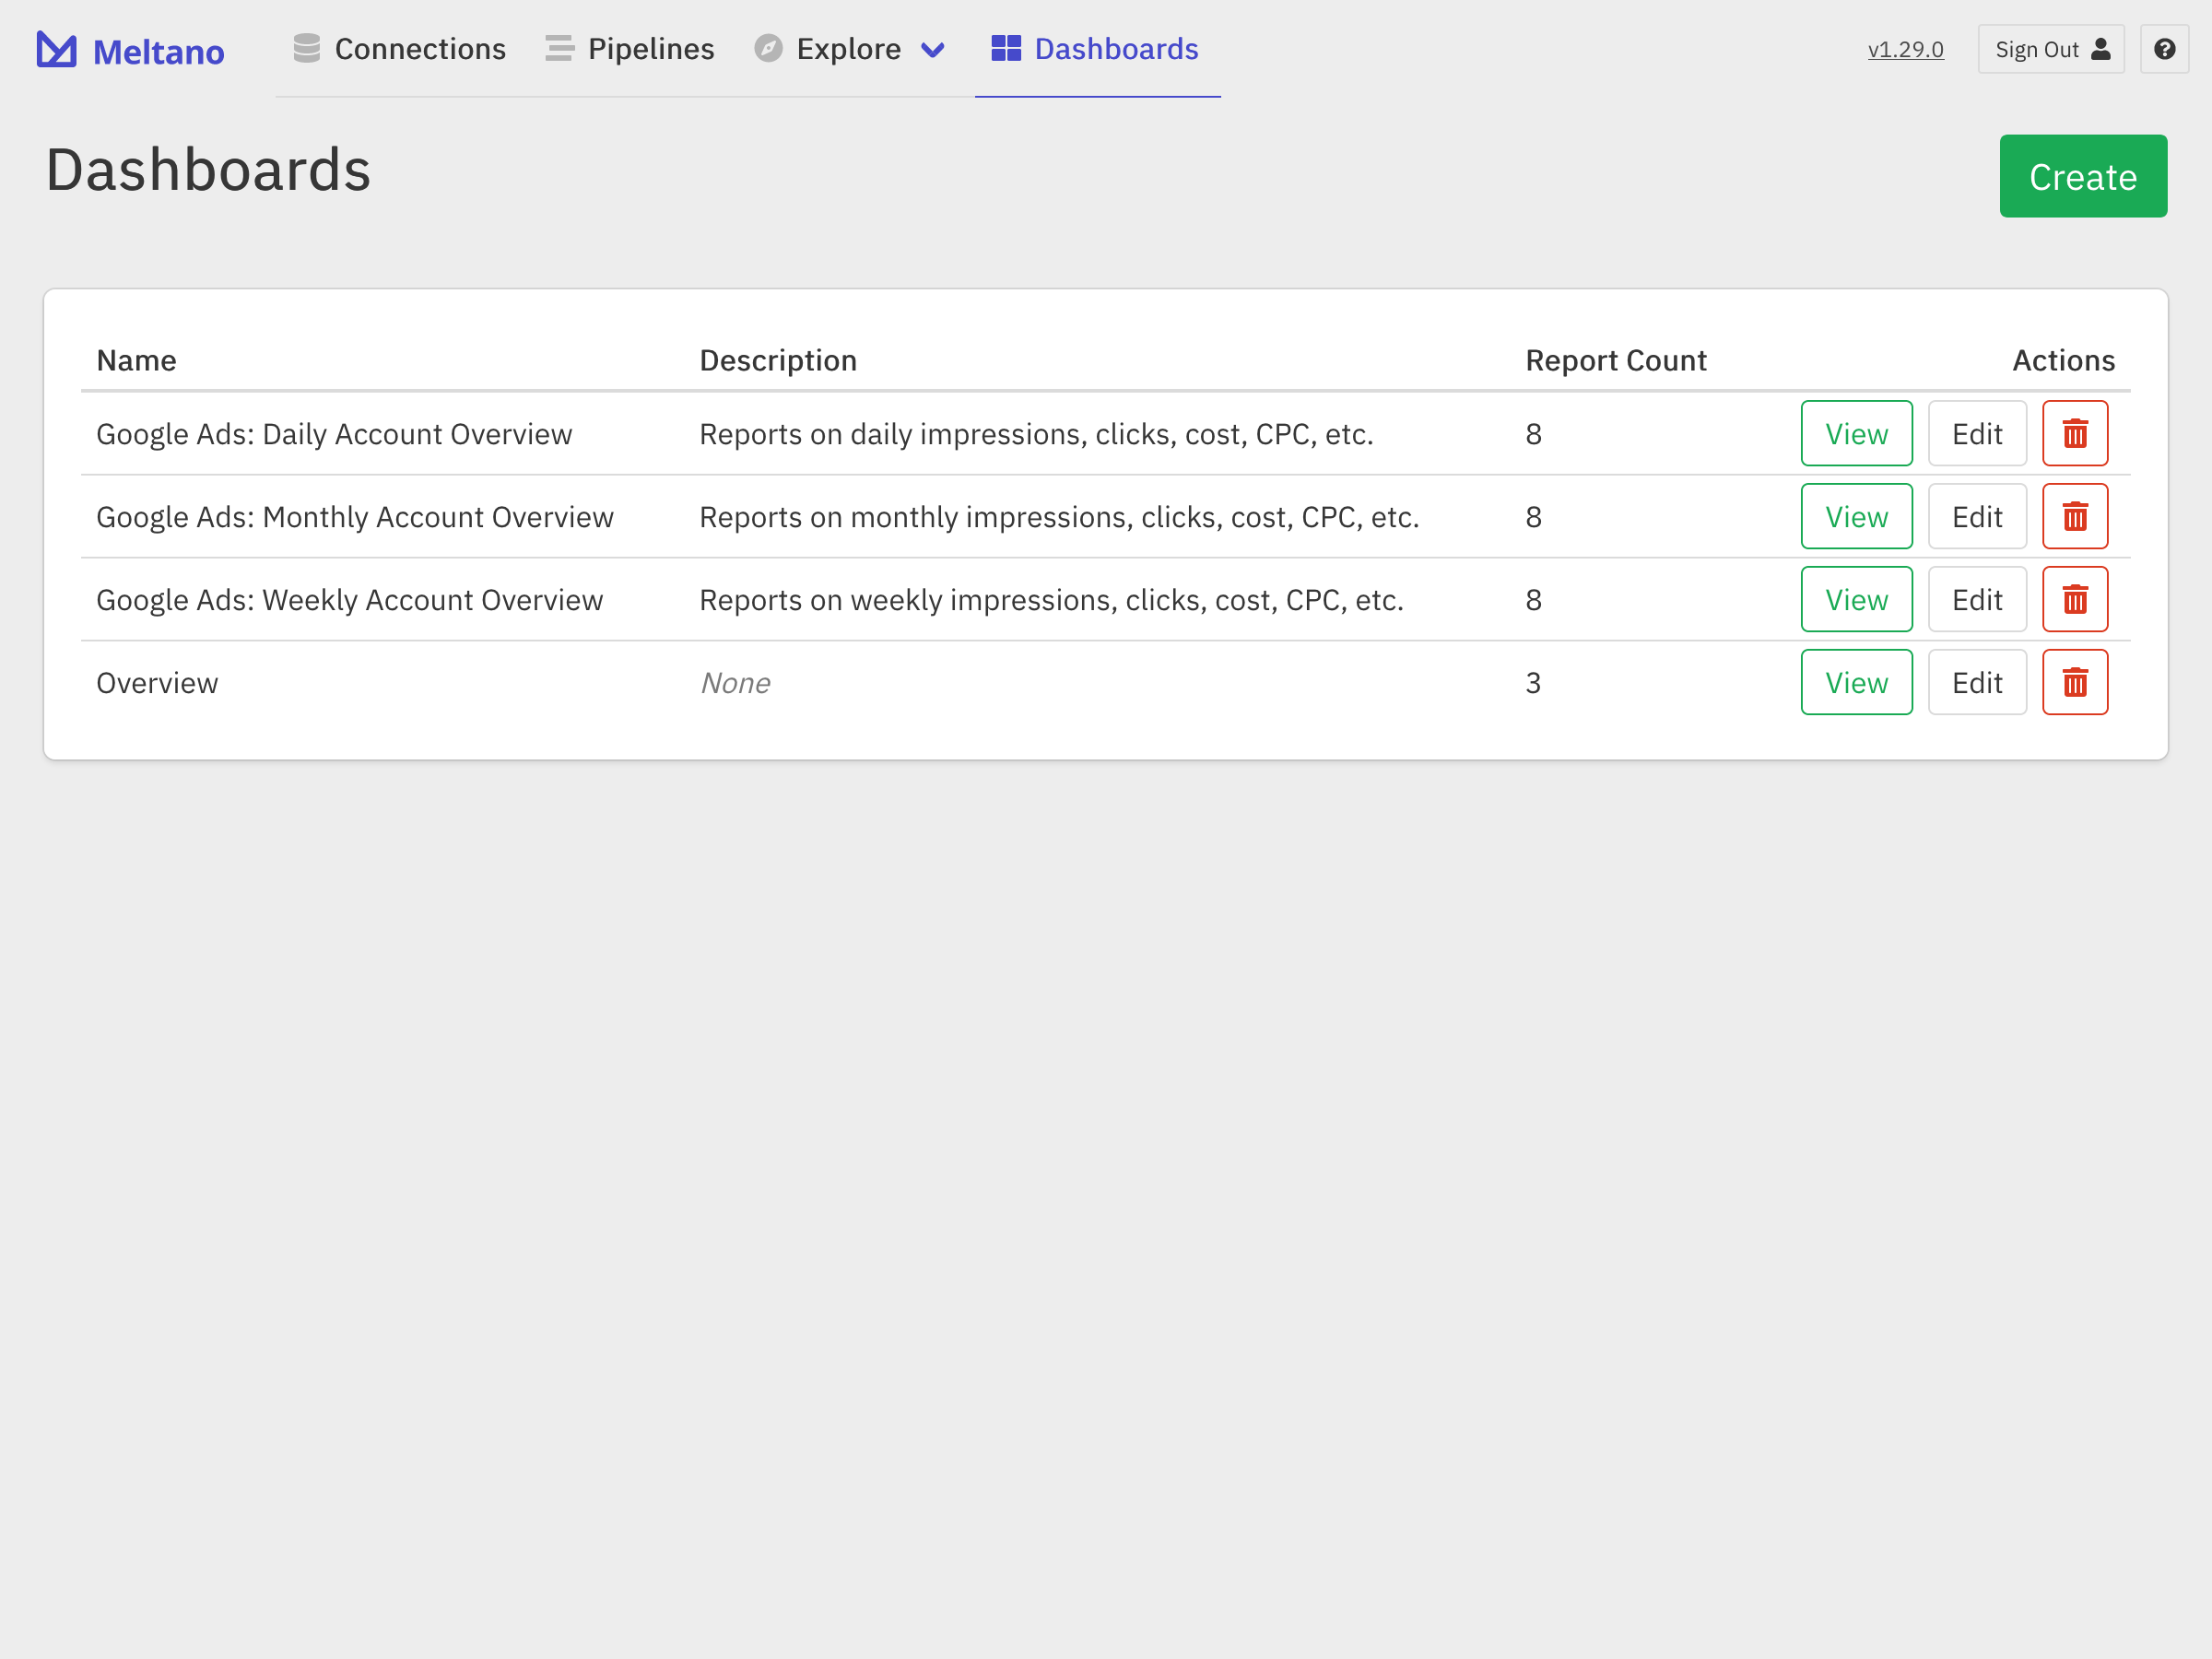
Once we select it, you will see the dashboard you created. You can repeat the above process to add more reports to the same and/or different dashboards.
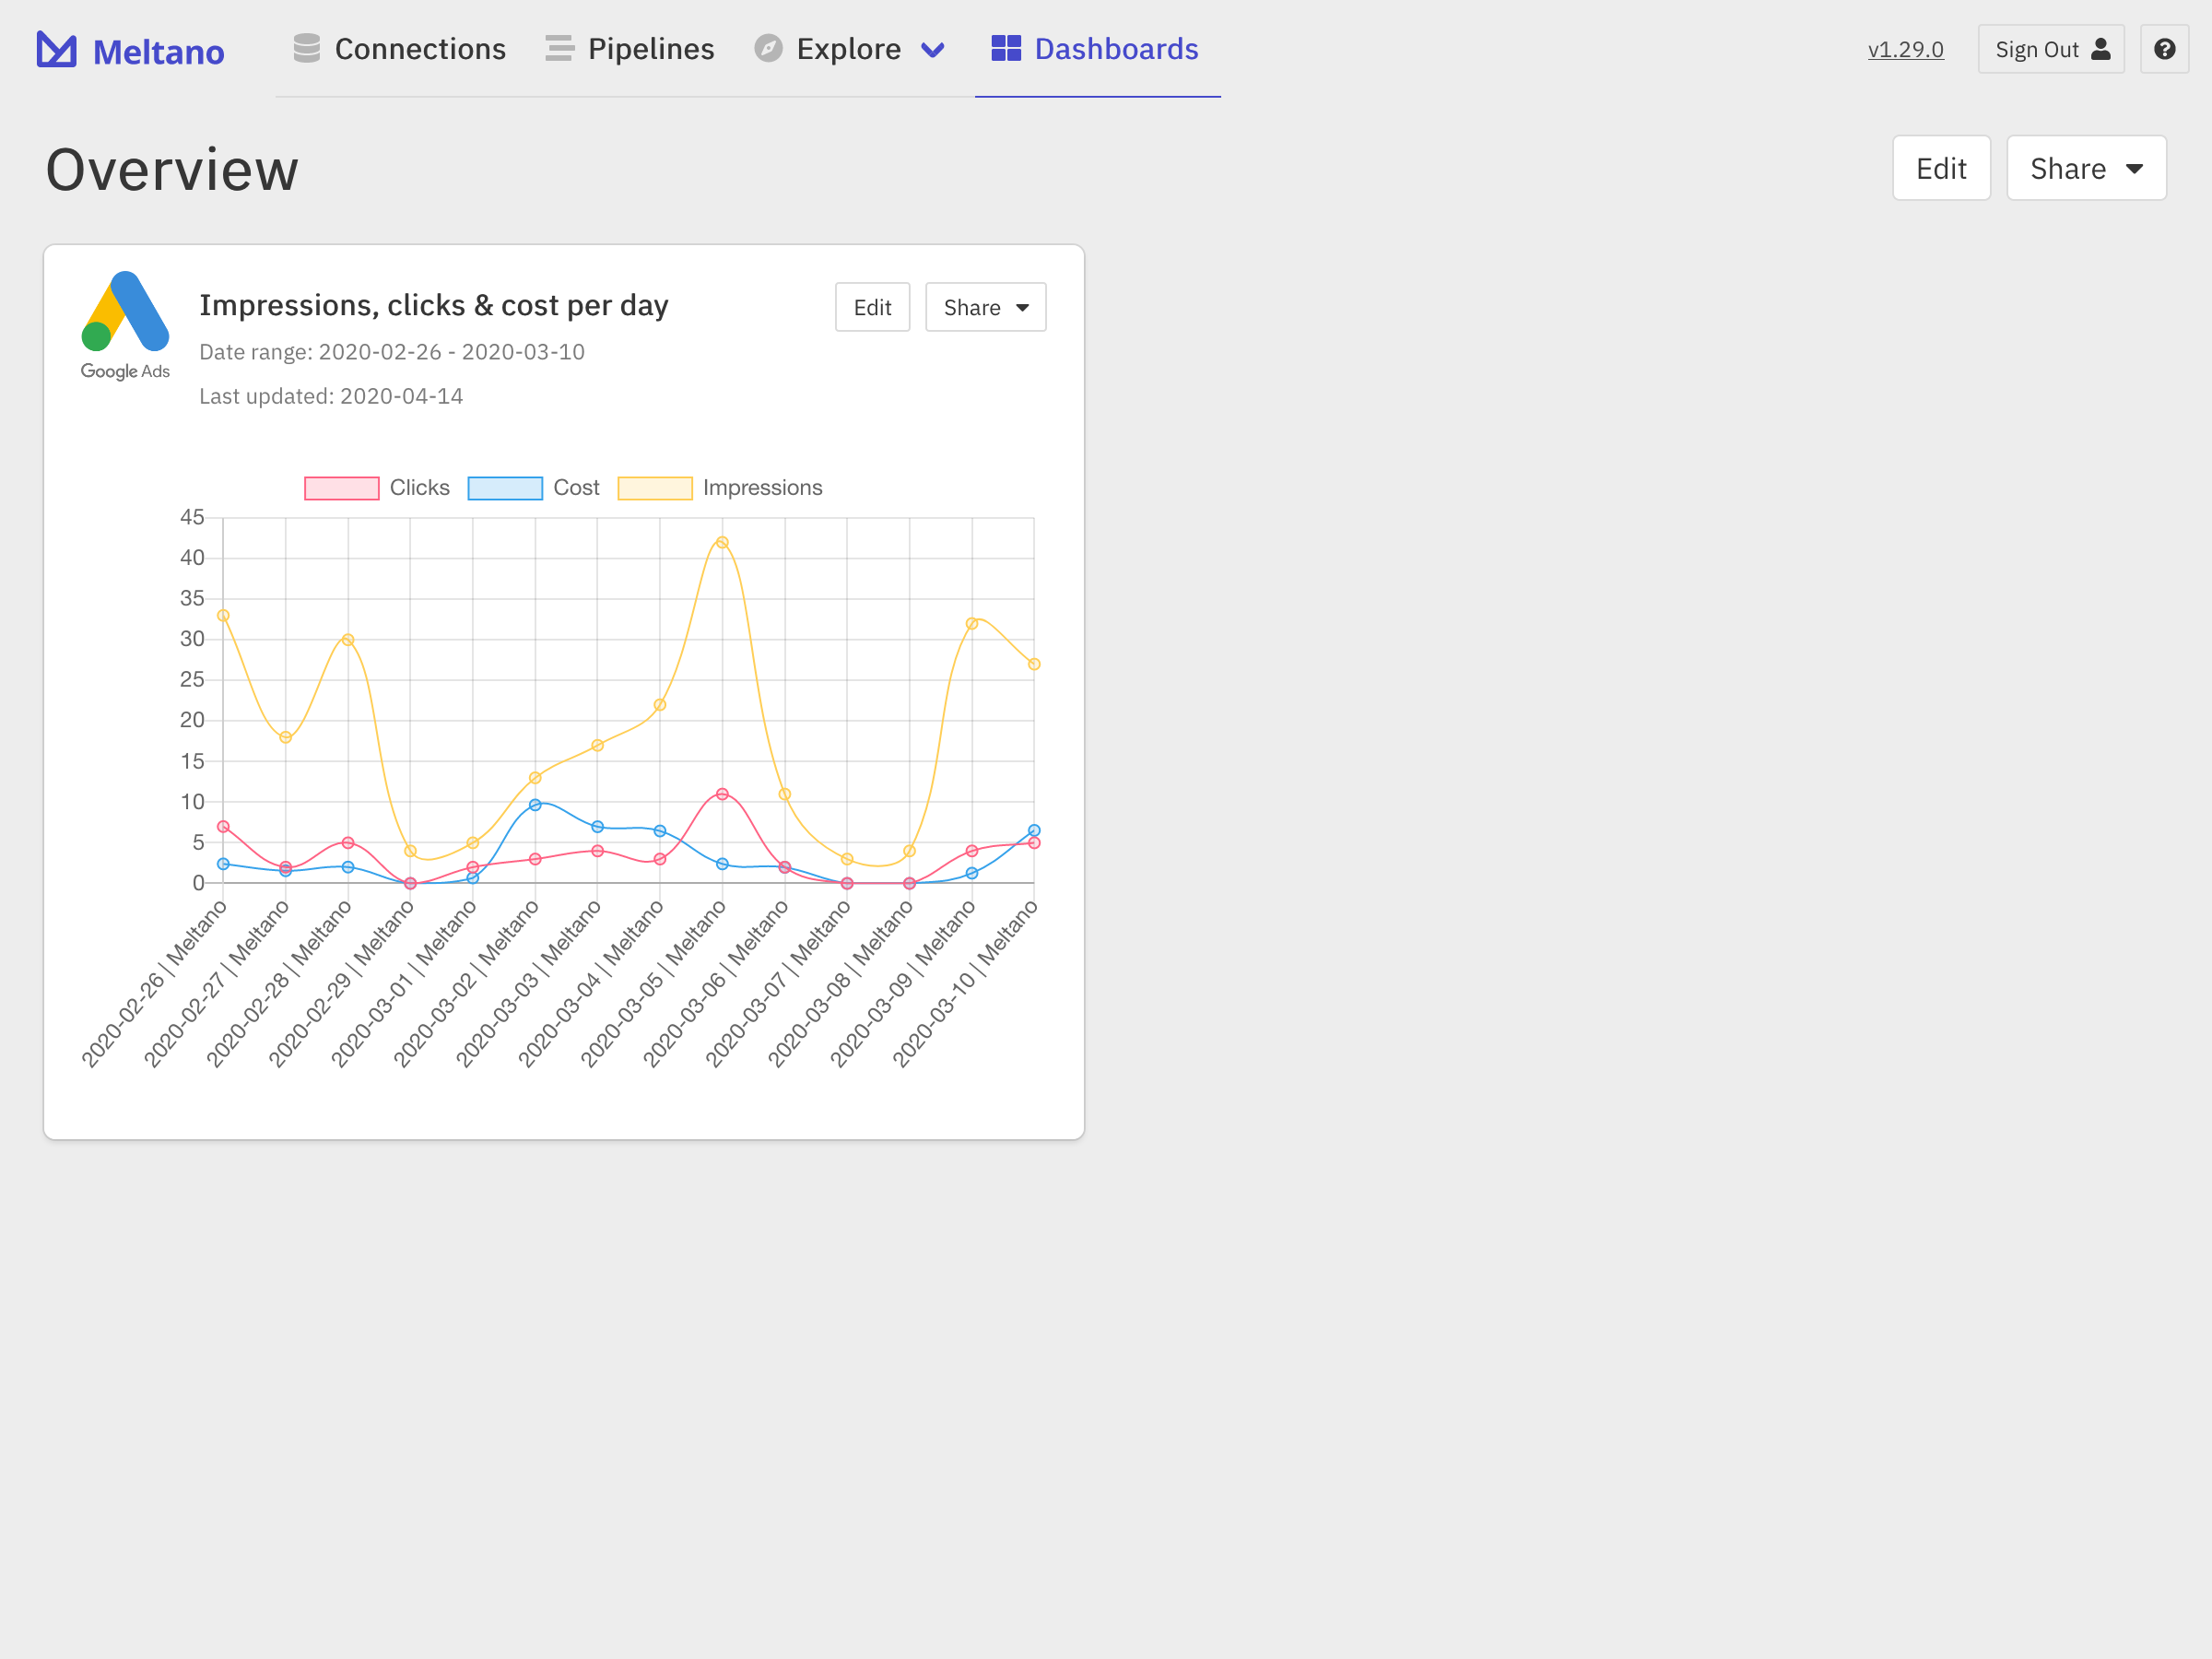
Share Reports and Dashboards #
Once you’ve created reports and dashboards, you can easily generate a read-only link or embed snippet using the Share button on the top right of the report or dashboard.
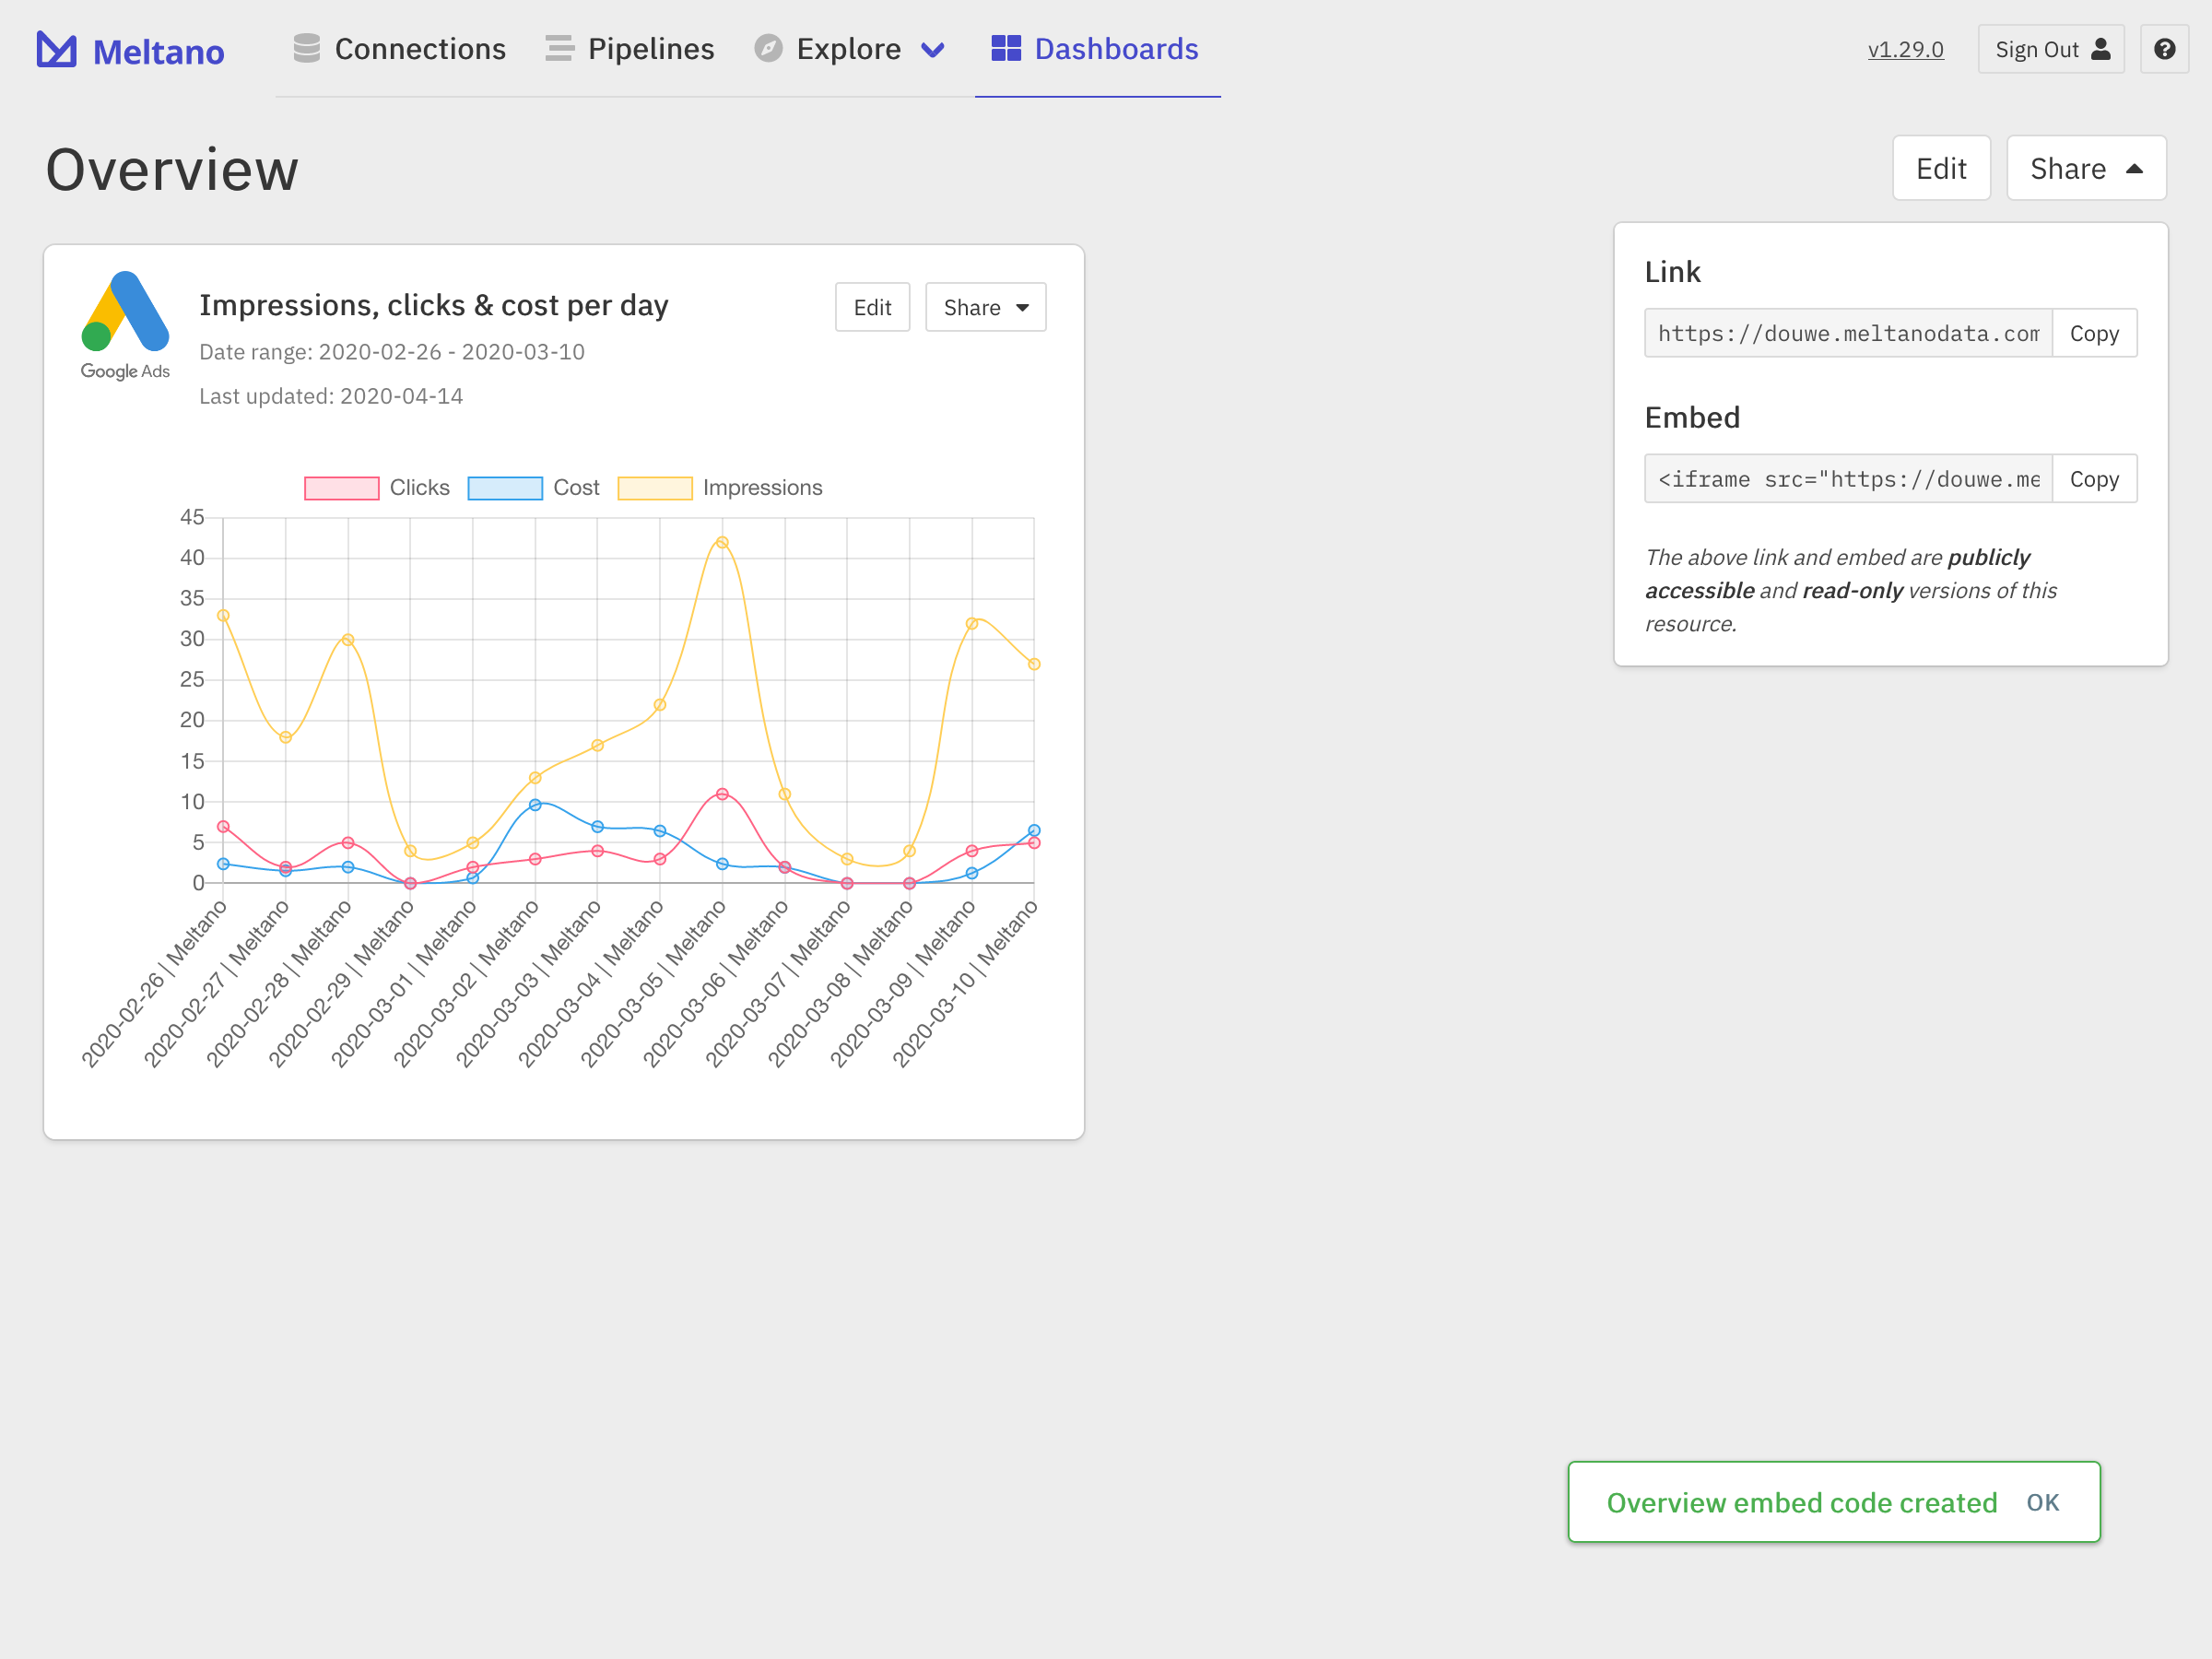
Using this link, anyone will be able to view the report or dashboard in question without needing to sign in to your Meltano instance, but they will not be able to make any changes. If you update the dashboard or report after the fact, or if new data is loaded into Meltano, the content at the shared link will automatically be updated as well.
Next Steps #
You have now set up a complete end-to-end data to dashboard sales funnel analysis solution with Meltano! 🎉
Next, you’ll want to make sure that all of your data sources are connected to Meltano, so that you can build your own high-level dashboards with reports for those metrics you care most about.
And if the report you’re looking for is not yet included with Meltano by default and cannot easily be created using the report builder, please let us know and we’ll gladly build it for you!